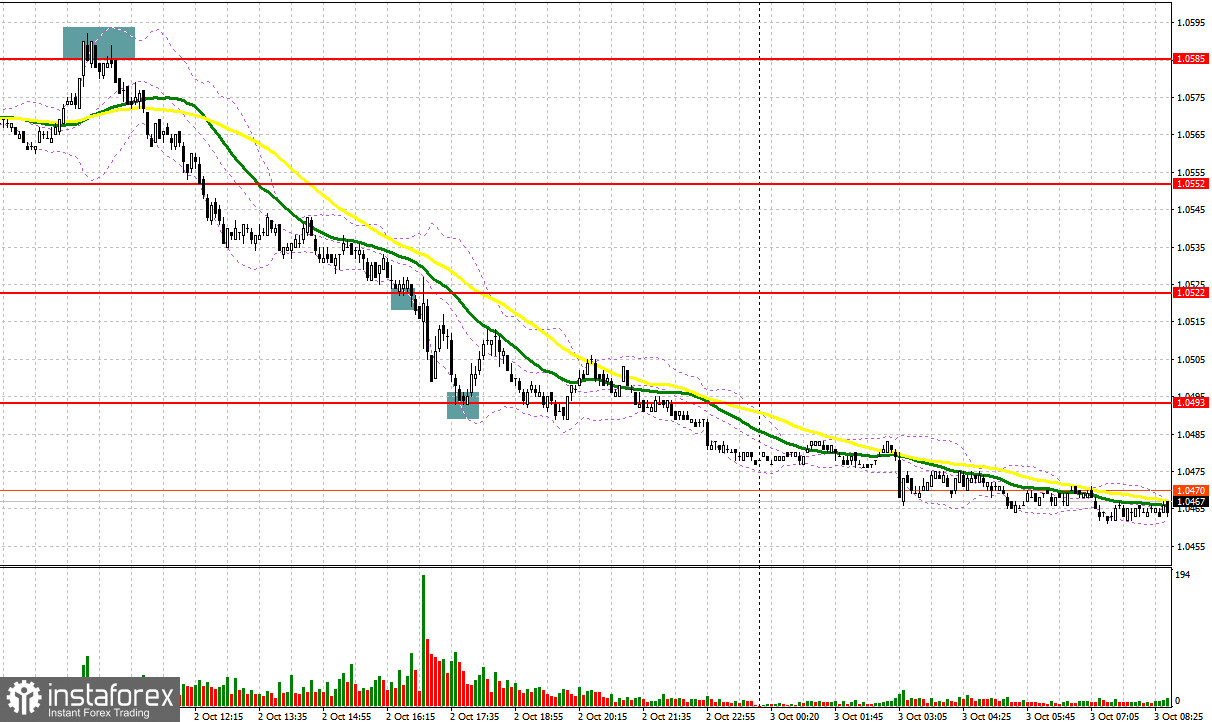
Yesterday, the pair formed several entry signals. Let's have a look at what happened on the 5-minute chart. In my morning review, I mentioned the level of 1.0585 as a possible entry point. A rise to this level and its false breakout generated a good entry signal to sell the euro which resulted in a decline of 40 pips. In the afternoon, attempts to protect the 1.0522 level failed, and buying on a false breakout at 1.0493 triggered an upward correction of 20 pips.
COT report
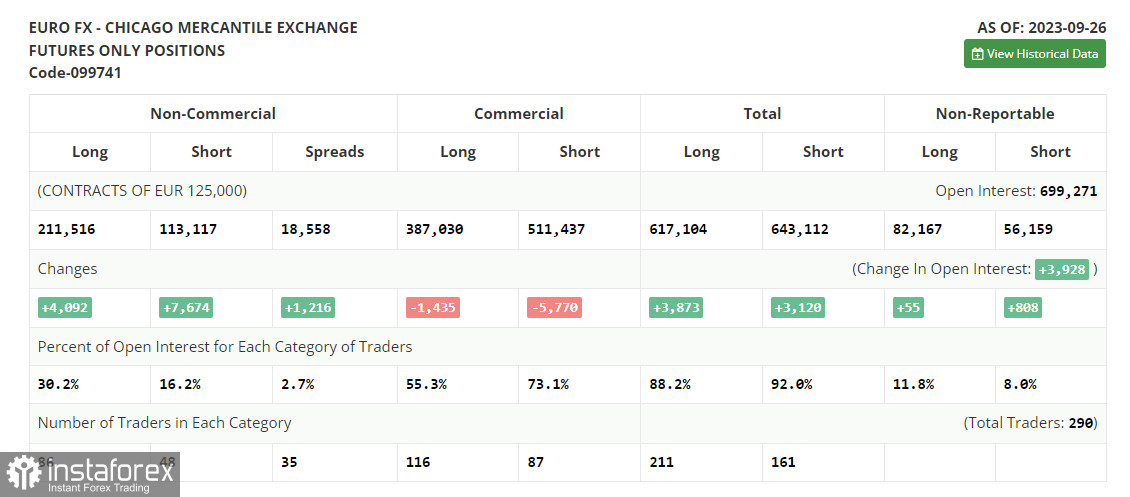
Before moving on to the EUR/USD forecast, let's first discuss the developments in the futures market and changes in the Commitments of Traders (COT). The COT report for September 26 showed a rise in both long and short positions, with the latter being almost twice as many. Adverse shifts in the Eurozone's economic landscape and looming threats of further interest rate hikes by the European Central Bank (ECB) have bolstered the prevailing bearish sentiment. Statements by ECB President Christine Lagarde were quite hawkish. Even the news about slowing inflation in August failed to help the euro withstand pressure from large sellers. A cheaper euro looks more appealing to traders in the medium term which is confirmed by the rise in long positions. The COT report indicates that non-commercial long positions jumped by 4,092 to stand at 211,516, while non-commercial short positions saw an increase of 7,674, reaching a total of 113,117. As a result, the spread between long and short positions increased by 1,216 contracts. The closing price dropped to 1.0604 from 1.0719, further underscoring the bearish market sentiment for EUR/USD.

For long positions on EUR/USD
Yesterday's downbeat data on the Eurozone's manufacturing activity and, by contrast, a rather strong report from the ISM in the US pushed the euro down. In addition, hawkish statements by US policymakers left no chance for EUR/USD bulls. With only an ECB Executive Board member, Philip Lane's speech on today's calendar, the chances of an upward correction in the pair remain very slim. I plan to trade against the downtrend, following a false breakout at the new yearly low of 1.0439. This will serve as confirmation of the entry point into long positions with the aim of returning back to the 1.0481 resistance level. Breaking and testing this range from above will bolster demand for the euro, providing an opportunity for a correction and a surge towards 1.0511, where the moving averages support bears. My ultimate target is the 1.0542 zone where I intend to take profits. If EUR/USD declines and there is no activity at 1.0439, bears will gain more control of the market. Only a false breakout near 1.0395 will signal a buying opportunity. I will initiate long positions immediately on a rebound from 1.0346, aiming for an upward correction of 30-35 pips within the day.
For short positions on EUR/USD
Sellers assert their strength every time the euro rises, highlighting their presence in the market. If there is an upward move in EUR/USD, bears need to defend the new resistance at 1.0481 formed yesterday. A false breakout there will provide an entry point, targeting the low of 1.0439. Only after a breakout below this level and consolidation, as well as an upward retest, will I look for another sell signal, aiming for 1.0395 where larger buyers might step in. My ultimate target will be the 1.0346 level where I will take profits. If EUR/USD rises during the European session and bears are absent at 1.0481, bulls might attempt an upward correction. However, this may only be possible if Philip Lane's speech has a dovish tone. In this scenario, I will delay going short until the price hits the new resistance at 1.0511. I may consider selling there but only after a failed consolidation. I will immediately initiate short positions on a rebound from the 1.0542 high, aiming for a downward correction of 30-35 pips.

Indicator signals:
Moving Averages
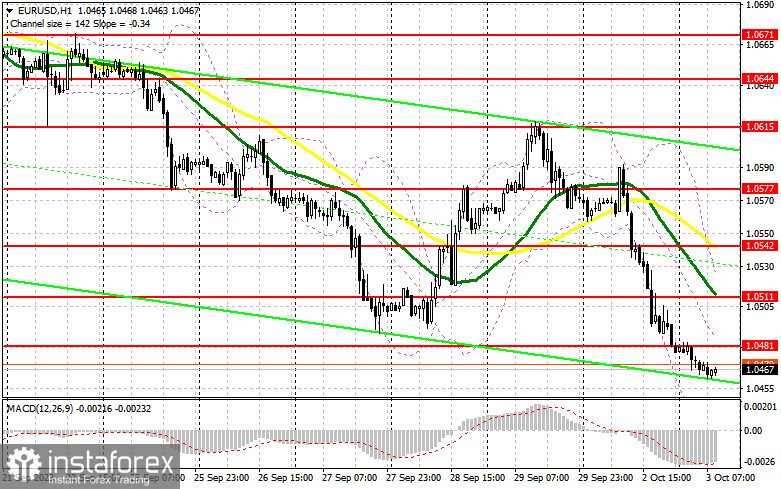
Trading below the 30- and 50-day moving averages indicates a further downtrend in the pair.
Please note that the time period and levels of the moving averages are analyzed only for the H1 chart, which differs from the general definition of the classic daily moving averages on the D1 chart.
Bollinger Bands
If the pair declines, the lower band of the indicator at 1.0439 will act as support. In case of an upward movement, the upper band of the indicator at 1.0542 will serve as resistance.
Description of indicators:
• A moving average of a 50-day period determines the current trend by smoothing volatility and noise; marked in yellow on the chart;
• A moving average of a 30-day period determines the current trend by smoothing volatility and noise; marked in green on the chart;
• MACD Indicator (Moving Average Convergence/Divergence) Fast EMA with a 12-day period; Slow EMA with a 26-day period. SMA with a 9-day period;
• Bollinger Bands: 20-day period;
• Non-commercial traders are speculators such as individual traders, hedge funds, and large institutions who use the futures market for speculative purposes and meet certain requirements;
• Long non-commercial positions represent the total number of long positions opened by non-commercial traders;
• Short non-commercial positions represent the total number of short positions opened by non-commercial traders;
• The non-commercial net position is the difference between short and long positions of non-commercial traders.