signal strength 1 of 5
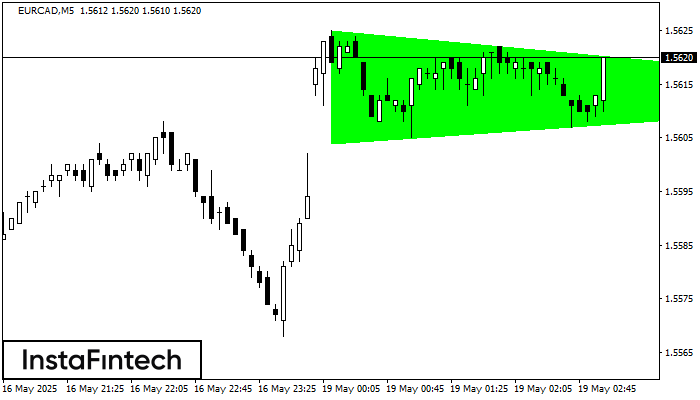
According to the chart of M5, EURCAD formed the Bullish Symmetrical Triangle pattern. Description: This is the pattern of a trend continuation. 1.5625 and 1.5604 are the coordinates of the upper and lower borders respectively. The pattern width is measured on the chart at 21 pips. Outlook: If the upper border 1.5625 is broken, the price is likely to continue its move by 1.5628.
The M5 and M15 time frames may have more false entry points.
See Also
- All
- Double Top
- Flag
- Head and Shoulders
- Pennant
- Rectangle
- Triangle
- Triple top
- All
- #AAPL
- #AMZN
- #Bitcoin
- #EBAY
- #FB
- #GOOG
- #INTC
- #KO
- #MA
- #MCD
- #MSFT
- #NTDOY
- #PEP
- #TSLA
- #TWTR
- AUDCAD
- AUDCHF
- AUDJPY
- AUDUSD
- EURCAD
- EURCHF
- EURGBP
- EURJPY
- EURNZD
- EURRUB
- EURUSD
- GBPAUD
- GBPCHF
- GBPJPY
- GBPUSD
- GOLD
- NZDCAD
- NZDCHF
- NZDJPY
- NZDUSD
- SILVER
- USDCAD
- USDCHF
- USDJPY
- USDRUB
- All
- M5
- M15
- M30
- H1
- D1
- All
- Buy
- Sale
- All
- 1
- 2
- 3
- 4
- 5

Mô hình Đáy ba đã được hình thành trên GOLD M5. Nó có các đặc điểm sau: mức kháng cự 3372.86/3370.25; mức hỗ trợ 3364.73/3364.26; chiều rộng là 813 điểm
Khung thời gian M5 và M15 có thể có nhiều điểm vào lệnh sai hơn.
Open chart in a new window
Theo biểu đồ của M15, #GOOG đã tạo thành Hình chữ nhật giảm. Mô hình này cho thấy sự tiếp tục của xu hướng. Đường viền trên là 170.41, đường
Khung thời gian M5 và M15 có thể có nhiều điểm vào lệnh sai hơn.
Open chart in a new window
Theo biểu đồ của M5, #TSLA đã hình thành mô hình Tam giác Cân Giảm. Mô hình này báo hiệu xu hướng giảm hơn nữa trong trường hợp đường biên
Khung thời gian M5 và M15 có thể có nhiều điểm vào lệnh sai hơn.
Open chart in a new window