signal strength 1 of 5
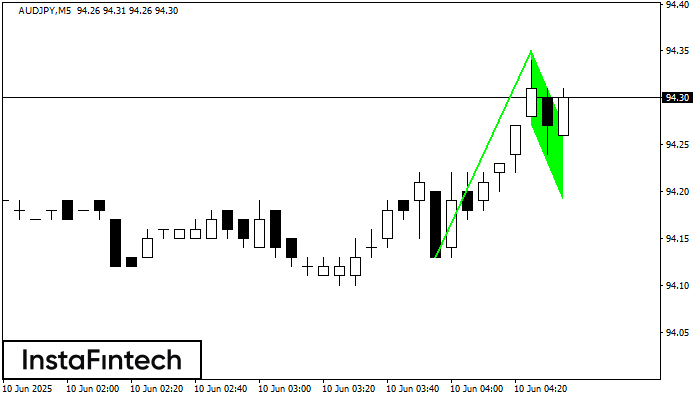
The Bullish Flag pattern has been formed on AUDJPY at M5. The lower boundary of the pattern is located at 94.27/94.19, while the higher boundary lies at 94.35/94.27. The projection of the flagpole is 22 points. This formation signals that the upward trend is most likely to continue. Therefore, if the level of 94.35 is broken, the price will move further upwards.
The M5 and M15 time frames may have more false entry points.
See Also
- All
- Double Top
- Flag
- Head and Shoulders
- Pennant
- Rectangle
- Triangle
- Triple top
- All
- #AAPL
- #AMZN
- #Bitcoin
- #EBAY
- #FB
- #GOOG
- #INTC
- #KO
- #MA
- #MCD
- #MSFT
- #NTDOY
- #PEP
- #TSLA
- #TWTR
- AUDCAD
- AUDCHF
- AUDJPY
- AUDUSD
- EURCAD
- EURCHF
- EURGBP
- EURJPY
- EURNZD
- EURRUB
- EURUSD
- GBPAUD
- GBPCHF
- GBPJPY
- GBPUSD
- GOLD
- NZDCAD
- NZDCHF
- NZDJPY
- NZDUSD
- SILVER
- USDCAD
- USDCHF
- USDJPY
- USDRUB
- All
- M5
- M15
- M30
- H1
- D1
- All
- Buy
- Sale
- All
- 1
- 2
- 3
- 4
- 5
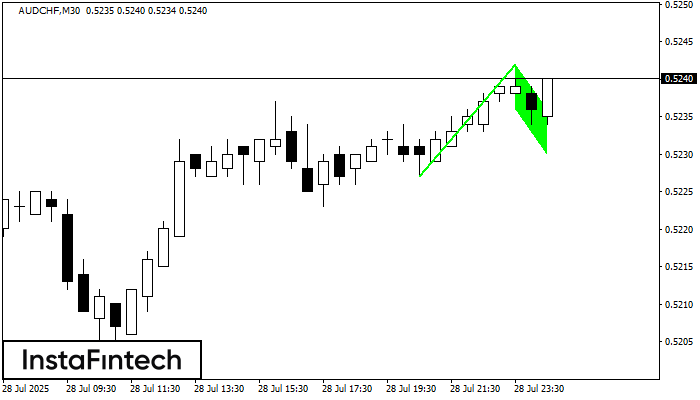
El patrón Bandera alcista ha sido formado en AUDCHF a M30. El límite inferior del patrón está ubicado en 0.5236/0.5230, mientras que el límite superior se encuentra en 0.5242/0.5236
Open chart in a new window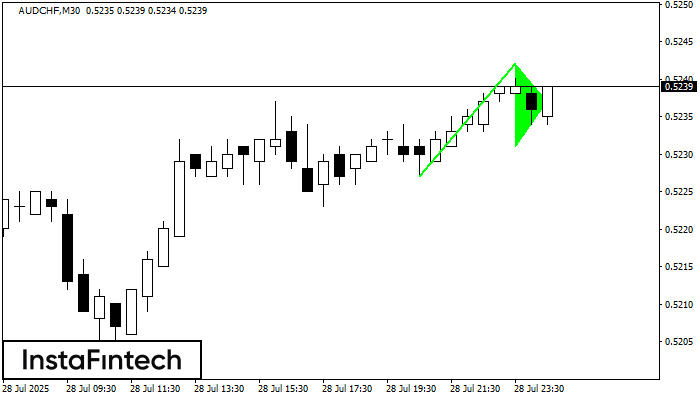
El patrón Banderín alcista está formado en el gráfico AUDCHF M30. Este es un tipo de patrón de continuación. Supuestamente, en caso de que el precio se fije por encima
Open chart in a new window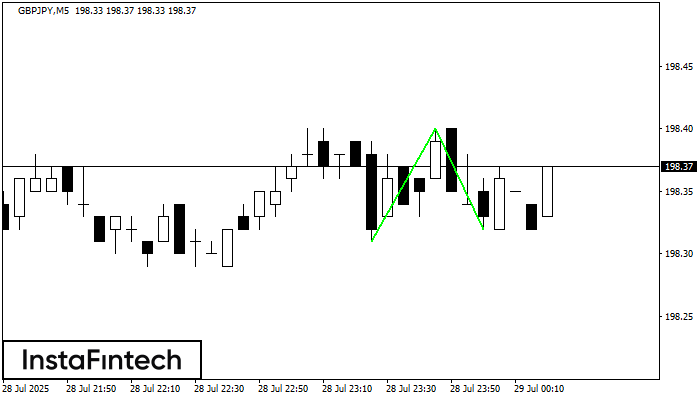
El patrón Doble Piso ha sido formado en GBPJPY M5. Características: el nivel de soporte 198.31; el nivel de resistencia 198.40; el ancho del patrón 9 puntos. Si el nivel
Los marcos de tiempo M5 y M15 pueden tener más puntos de entrada falsos.
Open chart in a new window