GBP/USD 5M
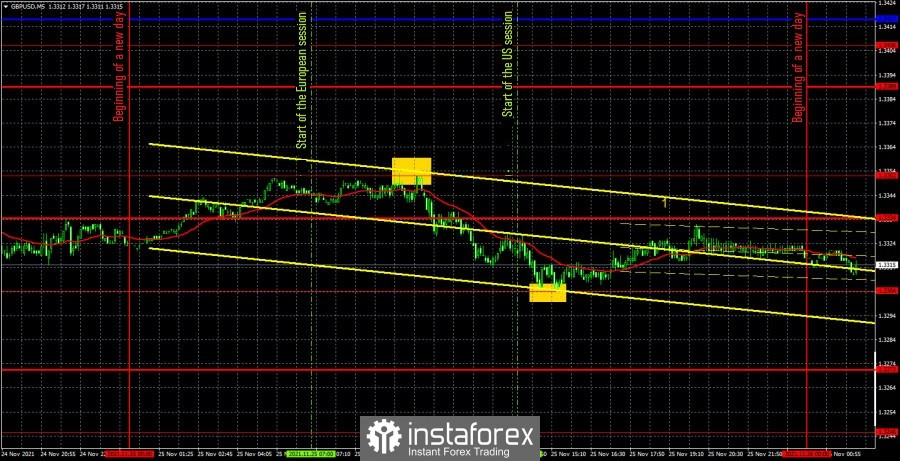
The GBP/USD pair moved very calmly on Thursday. The volatility of the day was only 50 points, which is an absolute minuscule for this pair. Of course, Thanksgiving in America played a role, as US traders took a day off. However, oddly enough, such weak volatility did not lead to a flat. The pair, on the contrary, moved very trendily during the past day. Bank of England Governor Andrew Bailey's speech (marked with the number "1" in the chart) did not give any important information and did not provoke any reaction from the markets. Thus, it remains only to consider the trading signals that were formed during Thursday. At first, the pair bounced perfectly from the extreme level of 1.3352. It happened at the European trading session. Therefore, traders had to open short positions. The price subsequently did not linger near the support level of 1.3334, but went straight down to the extreme level of 1.3304, from which it also bounced perfectly in accuracy. Thus, short positions should be closed (the profit was 32 points) and long positions should be opened on a buy signal. By the evening, the price managed to go up about 10-12 points after the signal was formed, but failed to reach the level of 1.3334 or 1.3352. Therefore, the long positions should have been manually closed at a profit of 10-12 points. In total, we managed to earn 35 points on two deals, which is very good for such a weak day.
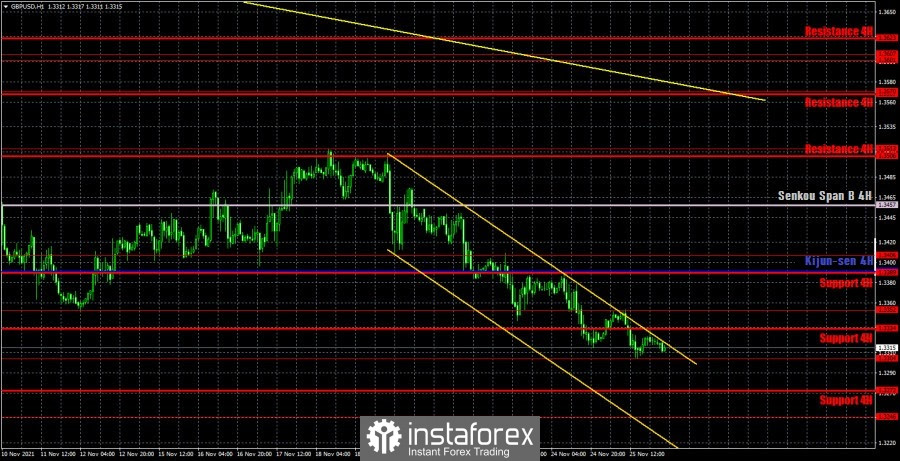
GBP/USD 1H

On the hourly timeframe, the pound/dollar pair continues to maintain a downward trend, as evidenced by both the trend line and the descending channel. The pair may leave the channel today, as it is very clear that the downward movement is slowing down. Nevertheless, it is impossible to predict the end of the entire downward trend. Especially with an empty calendar of macroeconomic and fundamental events. It remains only to rely on the "technique": levels and lines. We highlight the following important levels on November 26: 1,3246, 1,3304, 1,3352, 1,3406, 1,3513. The Senkou Span B (1.3457) and Kijun-sen (1.3390) lines can also be signal sources. Signals can be "rebounds" and "breakthroughs" of these levels and lines. It is recommended to set the Stop Loss level to breakeven when the price passes in the right direction by 20 points. The lines of the Ichimoku indicator can move during the day, which should be taken into account when searching for trading signals. There are no major events or publications scheduled for Friday in the UK and the US. Therefore, it is unlikely that serious price changes of the pair will occur today. Most likely, the day will be calm and only the desire of traders to take part of the profit on short positions can lead to a correction. You will have to trade exclusively on technique, which is probably for the best.
We recommend you to familiarize yourself:
Overview of the EUR/USD pair. November 26. European Union: the economic situation is deteriorating, the fourth "wave" is strengthening, the euro is falling.
Overview of the GBP/USD pair. November 26. Thanksgiving is not a reason to rest. Trade negotiations in Northern Ireland will drag on for several months.
Forecast and trading signals for EUR/USD for November 26. Detailed analysis of the movement of the pair and trade deals.
COT report
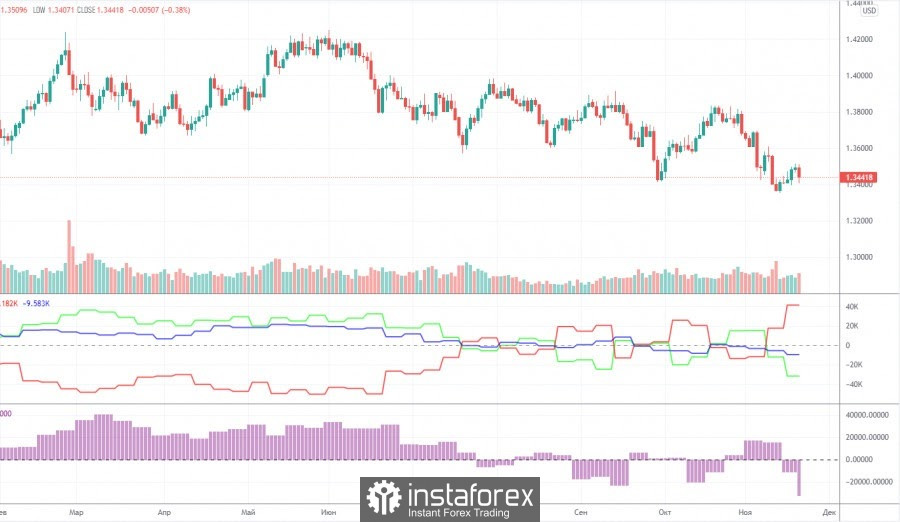
The mood of professional traders became much more bearish during the last reporting week. However, this should not be surprising, since the mood of major players has been constantly changing over the past few months, which perfectly reflects the first indicator in the chart above. The green and red lines, which indicate the net positions (in other words, the mood) of non-commercial and commercial traders, constantly change the direction of movement and constantly change their position relative to the zero level. The last reporting week only confirmed us in these conclusions. The green line has dropped significantly again, and the red line has increased significantly, although a couple of weeks ago it was the opposite. Thus, formally, the mood of professional traders has become more bearish, but in reality it changes every couple of weeks, so it is impossible to make a long-term conclusion. The non-commercial group closed 4,000 buy contracts (longs) and opened 17,000 sell contracts (shorts) during the reporting week. Thus, the net position decreased by 21,000 contracts at once, which is a lot for the pound. However, this does not matter much, since the net position of non-commercial traders also constantly jumps up and down, which is eloquently signaled by the second indicator in the chart above. It should also be noted that in the long term, the pound/dollar exchange rate itself also constantly jumps up and down. Thus, it is not possible to make a long-term forecast based on COT reports.
Explanations for the chart:
Support and Resistance Levels are the levels that serve as targets when buying or selling the pair. You can place Take Profit near these levels.
Kijun-sen and Senkou Span B lines are lines of the Ichimoku indicator transferred to the hourly timeframe from the 4-hour one.
Support and resistance areas are areas from which the price has repeatedly rebounded off.
Yellow lines are trend lines, trend channels and any other technical patterns.
Indicator 1 on the COT charts is the size of the net position of each category of traders.
Indicator 2 on the COT charts is the size of the net position for the non-commercial group.