empty
27.01.2023 09:02 AM
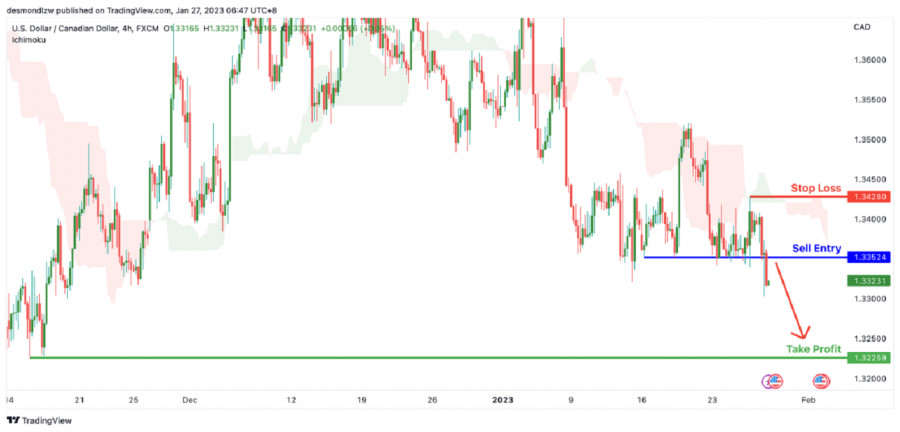
USDCAD Potential for Bearish Drop towards previous swing low

This image is no longer relevant

Description :

Looking at the H4 chart, my overall bias for USDCAD is bearish due to the current price crossing below the Ichimoku cloud, indicating a bearish market structure. Looking for a pullback sell entry at 1.33524, where the overlap resistance is. Stop loss will be at 1.34280, where the recent swing is. Take profit will be at 1.32259, where the previous swing low was.

Trading Recommendation

Entry: 1.33524

Reason for Entry: Where the overlap resistance is

Take Profit: 1.32259

Reason for Take Profit:

Previous swing low

Stop Loss: 1.34280

Reason for Stop Loss:

Recent high

Dean Leo,
Analytical expert of InstaForex
© 2007-2025
Select timeframe
5
min
15
min
30
min
1
hour
4
hours
1
day
1
week
Earn on cryptocurrency rate changes with InstaForex
Download MetaTrader 4 and open your first trade
  • Grand Choice
    Contest by
    InstaForex
    InstaForex always strives to help you
    fulfill your biggest dreams.
    JOIN CONTEST

Recommended Stories

Gold: new bullish formation

The price of gold retreated a little in the short term but the bias remains bullish. You already know from yesterday's analysis that XAU/USD could test and retest the immediate

Ralph Shedler 08:16 2023-10-31 UTC+2

USD/CAD challenging uptrend line

The USD/CAD pair jumped higher in the short term, reaching a new high of 1.3536. Now, it has turned to the downside and is located at 1.3481 at the time

Ralph Shedler 17:50 2023-09-28 UTC+2

CHF/JPY continuation or reversal?

The CHF/JPY pair moves sideways in the short term. It's trapped between 166.54 and 164.45 levels. It's trading at 164.73 at the time of writing

Ralph Shedler 18:42 2023-08-31 UTC+2

GBP/USD trapped between 1.2792 and 1.2625 levels

The GBP/USD pair is located at 1.2716 at the time of writing. As you can see on the H1 chart, the price is moving sideways between 1.2792 (upside obstacle)

Ralph Shedler 19:08 2023-08-23 UTC+2

EUR/USD: rebound seems over

The EUR/USD pair is moving sideways on lower time frames and it seems undecided. It's trading at 1.1013 at the time of writing and it looks poised to come back

Ralph Shedler 18:40 2023-07-31 UTC+2

AUD/JPY: deeper drop still in cards

The AUD/JPY pair is trading at 95.86 at the time of writing. As you can see on the H1 chart, the price could drop deeper as long as it stays

Ralph Shedler 23:13 2023-06-29 UTC+2

XAUUSD , H4 | Falling to support?

The XAU/USD (Gold/US Dollar) chart shows a bullish momentum, suggesting an upward trend. The price has the potential to continue rising towards the first resistance level. There are two support

Dean Leo 08:02 2023-06-07 UTC+2

EUR/USD , Daily | Rising into resistance?

The EUR/USD chart currently shows a weak bullishish momentum. There is a possibility for the price to continue its bullish movement, targeting the first resistance level.The first resistance at 1.08069

Dean Leo 10:04 2023-06-06 UTC+2

GBPUSD , Daily | Falling tp Support??

The GBP/USD chart currently shows a bearish momentum, indicating a downward trend. There is a possibility for the price to continue its bearish movement, targeting the first support level

Dean Leo 07:25 2023-06-05 UTC+2

EUR/USD , H4 | Falling to 1st support?

The EUR/USD chart shows a bearish momentum as the price remains below a major descending trend line and the bearish Ichimoku cloud. This indicates a presence of bearish pressure

Dean Leo 07:28 2023-06-01 UTC+2
Can't speak right now?
Ask your question in the chat.
Widget callback