At the auction on June 13-17, the main currency pair of the Forex market demonstrated a rather ambiguous price dynamics, as a result of which a rather curious candle appeared on the weekly chart. However, more on this a little later. For now, we will briefly touch on the events that have already died down and those that are waiting for EUR/USD this week. It will not be difficult to state that last week the main event for the markets and the euro/dollar was the decision of the US Federal Reserve System (FRS) on interest rates. Admittedly, the increase in the federal funds rate by 75 basis points at once, and not by the predicted 50, was in many ways an unexpected step and should have led to a strengthening of the US dollar. However, this did not happen, and after the two previous rate hikes by 25, and then by 50 bps, the US dollar was sold in fact, since before that it was growing on expectations. However, there is one very important point.
If the Fed's rate hike coincided with expectations the previous two times, then last Wednesday it exceeded them. Nevertheless, even with such a seemingly positive scenario for the US dollar, it did not escape the fate of being sold again. A rather curious and, from my point of view, far from the adequate reaction of investors to the rate increase, which turned out to be higher than forecasts. At the same time, the Fed does not think to slow down the "hawkish" momentum, signaling to the markets in every possible way that if inflation continues to rise, the actions of the US Central Bank will be even more aggressive. This week, perhaps, the most attention will be attracted by the speech of Fed Chairman Jerome Powell with the semi-annual report on monetary policy, which he will deliver for two days, on June 22 and 23. Well, it's time to turn your attention to the EUR/USD price charts, and, as usual, on Mondays, we begin the technical analysis of the main currency pair with a weekly timeframe.
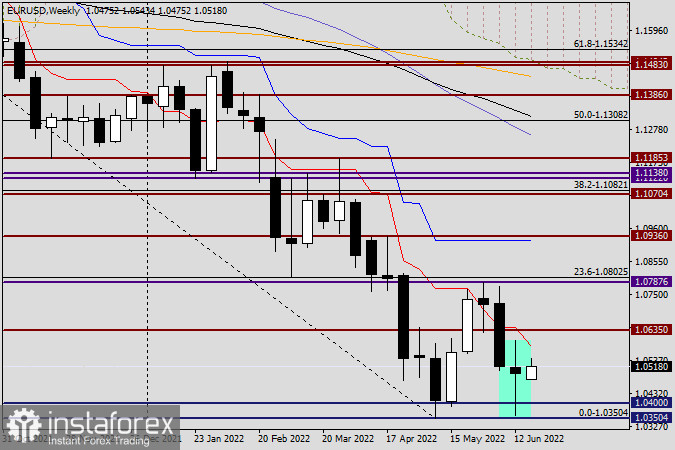
Weekly
The highlighted candle, which at the beginning of this review was characterized as quite curious, is provided for your judgment. According to candle analysis, this candle is nothing but a reversal model of the "Long-Legged Doji". At the same time, I strongly recommend paying attention to the fact where the start of the formation of this reversal model of candle analysis was taken from. That's right, immediately after the decline to a very strong technical and historical level, which now plays the role of key support of1.0350. I am more than sure that this is not an accident at all. The price area of 1.0400-1.0350 strongly restrains the attacks of bears on EUR/USD and does not let the quote lower. Due to the special importance of the support level of 1.0350, I would venture to assume that in the event of a true breakdown of this mark, the single European currency will face huge troubles associated with its subsequent and, most likely, a landslide fall.
Based on my experience of many years of observing the behavior of the market, I can say with confidence that after a true (with consolidation) breakdown of such strong levels, whether it is support or resistance, which have been impassable for a long time, the movement towards the breakdown acquires a second wind, which is expressed in a very strong movement towards this very breakdown. However, at the moment, the last weekly candle mostly assumes the subsequent growth of the EUR/USD pair. If the market starts working out the designated model, and the pair rewrites the previous highs, shown just at another very important and strong technical level of 1.0600, we expect a continuation of the rise to the important price zone of 1.0635-1.0643, where the landmark historical level of 1.0635 passes, and the red line of the Tenkan Ichimoku indicator is located at 1.0643. The passage of this barrier will open the way to even higher prices.
Daily
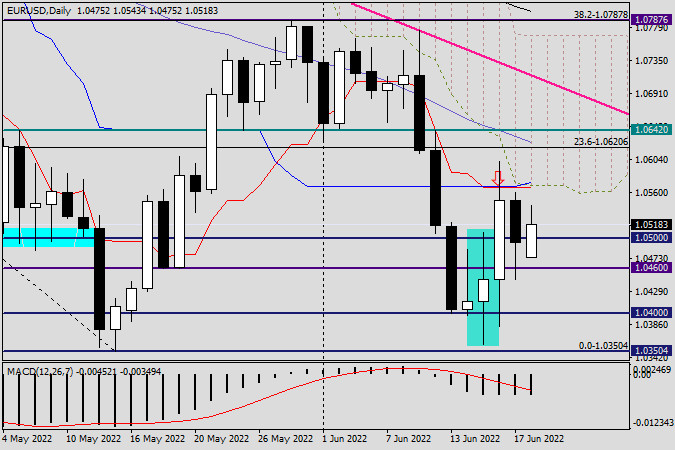
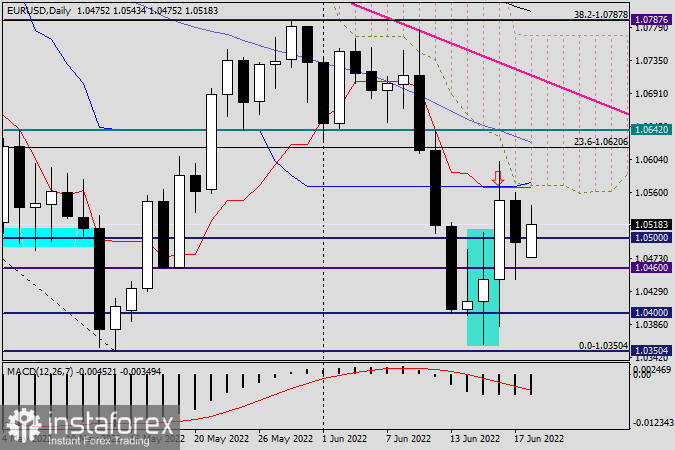
Looking at the daily euro/dollar chart, I would like to note the Tenkan and Kijun lines of the Ichimoku indicator again. It is not for nothing that the author mentions them in almost every article and draws attention to these very important indicators for the price. They are even more powerful as support or resistance when they merge. This is exactly what happened at 1.0567 and look at the reaction of the quote. I think it is not necessary to prove that the pair met very strong resistance here, after which it moved to the decline phase on the last day of last week's trading. However, the bullish reversal pattern on the weekly chart, as well as the long shadow of Friday's bearish candle, are more likely to signal the pair's desire for growth. If so, I suggest waiting for the true breakdown and consolidation of the Ichimoku indicator over the Tenkan and Kijun daily lines, after which, on a rollback to the 1.0560 area, consider options for opening long positions. Today, this is the main trading recommendation. However, tomorrow's article on EUR/USD will cover smaller time intervals, where we will try to find relevant positioning options within the day.