empty
16.03.2023 03:50 PM
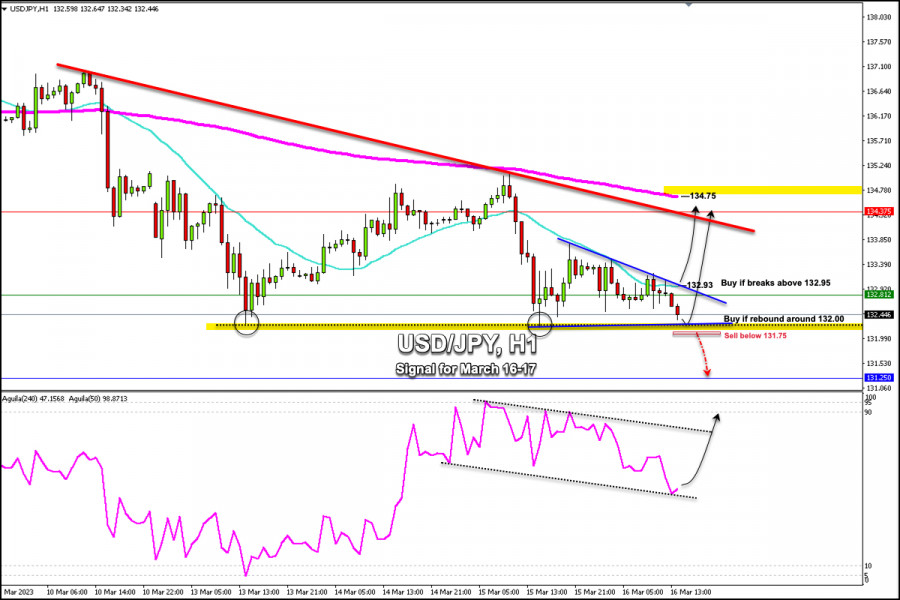
Trading Signal for USD/JPY for March 16 - 17, 2023: buy if rebound around 132.00 (5/8 Murray - strong support)

This image is no longer relevant

The 1-hour chart shows that USD/JPY has found strong support that is located around 132.00 – 131.80.

Currently, the instrument is trading below the 5/8 Murray (132.81) and below 21 SMA (132.93). If it fails to consolidate above 132.00, we could expect a continuation of the downtrend and the price could reach 131.50 and down to 4/8 Murray 131.25.

On the other hand, in case USD/JPY trades above 132.93 and if it surpasses the 21 SMA, we could expect a continuation of the upward movement and the instrument could reach 6/8 Murray at 134.37

The outlook is bearish as the pair is showing oversold signs, although the overall picture offers mixed signals. If the bullish move extends above 134.72 (200 EMA), the currency pair could gain further momentum and could reach 137.50 (8/8 Murray). Conversely, a drop below 131.75 could push the price to the weekly low of 131.25.

If the USD/JPY pair consolidates above 132.00 in the next few hours, it could continue with an upward move and could reach 134.37 (6/8 Murray). The eagle indicator is in the oversold zone. So, while the pair is trading above 132.00, any correction will be seen as an opportunity to buy.

Dimitrios Zappas,
Analytical expert of InstaForex
© 2007-2025
Summary
Urgency
Analytic
Dimitrios Zappas
Start trade
Earn on cryptocurrency rate changes with InstaForex
Download MetaTrader 4 and open your first trade
  • Grand Choice
    Contest by
    InstaForex
    InstaForex always strives to help you
    fulfill your biggest dreams.
    JOIN CONTEST

Recommended Stories

Trading Signals for GOLD (XAU/USD) for August 4-7, 2025: sell below $3,385 (21 SMA - 6/8 Murray)

In the coming hours, we can sell gold below 3,385 with a target at the 6/8 Murray level at 3,359. If gold breaks below this area, we could resume short

Dimitrios Zappas 17:39 2025-08-04 UTC+2

Trading Signals for BITCOIN (BTC/USD) for August 4-7, 2025: sell below $115,625 or buy above $114,086 (200 EMA - 21 SMA)

If Bitcoin resumes its bearish cycle, we could expect it to fall below $114,000. Then, it could reach the 4/8 Murray line and 112,500, and even fall to the bottom

Dimitrios Zappas 17:22 2025-08-04 UTC+2

Trading Signals for EUR/USD for August 4-7, 2025: sell below 1.1602 (200 EMA - 7/8 Murray)

Early in the American session, the euro is trading around 1.1580, below the 200 EMA and with a strong technical rebound. After the sharp drop due to the US Non-Farm

Dimitrios Zappas 17:20 2025-08-04 UTC+2

Technical Analysis for August 2025 – GBP/USD

In July, the pair moved downward and nearly tested the 8-period EMA at 1.3164 (thin blue line), closing the monthly candle at 1.3203. In August, an upward price movement

Stefan Doll 12:03 2025-08-04 UTC+2

Technical Analysis for August 2025 – EUR/USD

In July, the pair moved downward, broke through the 23.6% retracement level at 1.1438 (yellow dashed line), and closed the monthly candle at 1.1414. In August, an upward price movement

Stefan Doll 12:00 2025-08-04 UTC+2

Forecast for EUR/USD on August 4, 2025

On Friday, the EUR/USD pair reversed near the 161.8% corrective level at 1.1416, turning in favor of the euro and surging sharply. The consolidation above the 100.0% Fibonacci level

Samir Klishi 11:49 2025-08-04 UTC+2

GBP/USD – August 4th: Will the Pound Benefit from the Dollar's Setback?

On the hourly chart, the GBP/USD pair reversed in favor of the British pound on Friday and consolidated above the 127.2% Fibonacci level at 1.3258. Thus, on Monday, the upward

Samir Klishi 11:46 2025-08-04 UTC+2

GBP/USD. Technical Analysis for the Week of August 4–9

Last week, the pair moved downward and tested the 38.2% retracement level at 1.3141 (red dashed line), after which the price moved upward and closed the weekly candle at 1.3278

Stefan Doll 11:38 2025-08-04 UTC+2

EUR/USD. Technical analysis for the week of August 4-9

Last week, the pair moved downward and nearly tested the 61.8% retracement level at 1.1378 (red dotted line), before reversing upward and closing the weekly candle at 1.1586

Stefan Doll 10:38 2025-08-04 UTC+2

GBP/USD. Indicator Analysis and Daily Review on August 4, 2025

On Friday, the pair moved downward, testing support at 1.3148 (blue dotted line), then rose on news releases and closed the daily candle at 1.3278. Today, the price is expected

Stefan Doll 10:28 2025-08-04 UTC+2
Can't speak right now?
Ask your question in the chat.
Widget callback
 

Dear visitor,

Your IP address shows that you are currently located in the USA. If you are a resident of the United States, you are prohibited from using the services of InstaFintech Group including online trading, online transfers, deposit/withdrawal of funds, etc.

If you think you are seeing this message by mistake and your location is not the US, kindly proceed to the website. Otherwise, you must leave the website in order to comply with government restrictions.

Why does your IP address show your location as the USA?

  • - you are using a VPN provided by a hosting company based in the United States;
  • - your IP does not have proper WHOIS records;
  • - an error occurred in the WHOIS geolocation database.

Please confirm whether you are a US resident or not by clicking the relevant button below. If you choose the wrong option, being a US resident, you will not be able to open an account with InstaForex anyway.

We are sorry for any inconvenience caused by this message.