empty
29.03.2023 05:25 PM
Technical analysis of GBP/USD for March 29, 2023

This image is no longer relevant

Overview:

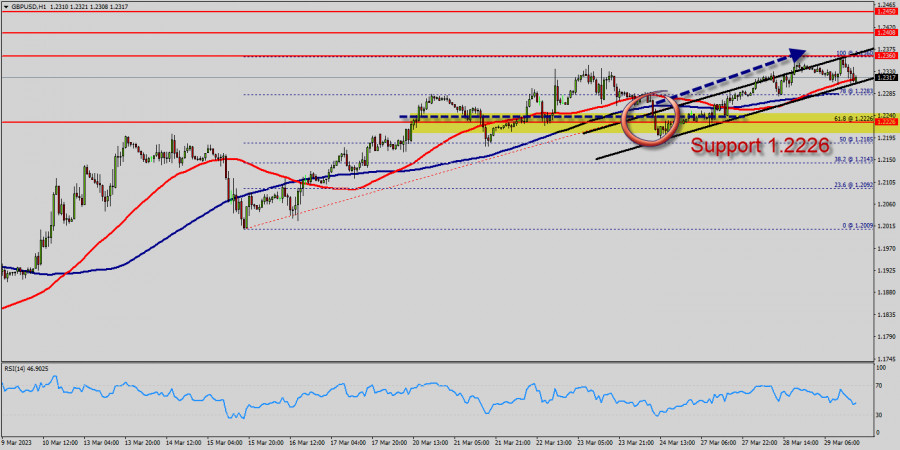
The GBP/USD pair has faced strong support at the level of 1.2226 because resistance became support. So, the strong resistance has been already faced at the level of 1.2226 and the pair is likely to try to approach it in order to test it again. The level of 1.2121 represents a weekly pivot point for that it is acting as minor support this week. Furthermore, the EUR/USD pair is continuing to trade in a bullish trend from the new support level of 1.2173. Currently, the price is in a bullish channel. According to the previous events, we expect the EUR/USD pair to move between 1.2121 and 1.2341. Also, it should be noticed that the double top is set at 1.2341. Additionally, the RSI is still signaling that the trend is upward as it remains strong above the moving average (100). This suggests the pair will probably go up in coming hours. Accordingly, the market is likely to show signs of a bullish trend. In other words, buy orders are recommended above 1.2226 with the first target at the level of 1.2341. If the trend is be able to break the double top at the level of 1.2341, then the market will continue rising towards the weekly resistance 1 at 1.2400. On the other hand, if the GBP/USD pair fails to break through the resistance level of 1.2341 this week, the market will decline further to 1.2121. The pair is expected to drop lower towards at least 1.2100 with a view to test the weekly pivot point. Also, it should be noted that the weekly pivot point will act as minor support today at the price 1.2121.

ndicators :

This would suggest a bearish market because the moving average (100) is still in a positive area and does not show any trend-reversal signs at the moment. EMAs gives more weight to the most recent periods, because moving average is quick moving and works well at showing recent price swings. On the other hand, Simple Moving Average (SMA) displays a smooth chart which which removes most false signals. Moreover, with using SMAs, you can know whether a pair is trending up or trending down. Consequently, if you want to obtain a clearer signal of whether the pair is trending up or down if you combine two or more moving averages because simple and exponential are the two major types of moving averages.

Signals:

The trend is still bullish as long as the price of 1.2226 is not broken. Thereupon, it would be wise to buy below the price of at 1.2226 with the primary target at 1.2360. Then, the GBP/USD pair will continue towards the second target at 1.2408 . The breakdown of 1.2226 will allow the pair to go further down to the prices of 1.2121.

Summary
Urgency
Analytic
Mourad El Keddani
Start trade
Earn on cryptocurrency rate changes with InstaForex
Download MetaTrader 4 and open your first trade
  • Grand Choice
    Contest by
    InstaForex
    InstaForex always strives to help you
    fulfill your biggest dreams.
    JOIN CONTEST

Recommended Stories

EUR/USD. The Pair May Correct Downward Amid Trump's Speech

Today, U.S. President D. Trump is scheduled to speak. Investors, already aware that he might throw in something unexpected, are reducing part of their long positions in the pair just

Pati Gani 10:03 2025-08-14 UTC+2

XAU/USD. Analysis and Forecast

The breakout above the $3358 level, where the 100-period Simple Moving Average (SMA) on the 4-hour chart is located, against the backdrop of the earlier confirmed hold above the 200-period

Irina Yanina 08:38 2025-08-14 UTC+2

There was an attempt to strengthen despite a weakening bias in the commodity asset Palladium against the USD. Thursday, August 14, 2025.

[XPD/USD] – [Thursday, August 14, 2025] Although the bias for Palladium remains weakening, as indicated by the Death Cross of the two EMAs, the RSI (14) which

Arief Makmur 06:21 2025-08-14 UTC+2

Today, the Nasdaq 100 index has the potential to weaken to its nearest support level. Thursday, August 14, 2025.

[Nasdaq 100 Index] – [Thursday, August 14, 2025] Although the EMA (50) is still forming a Golden Cross above the EMA(200), the RSI (14) indicator, which is at a neutral

Arief Makmur 06:21 2025-08-14 UTC+2

EUR/USD Forecast for August 14, 2025

The euro has consolidated above the daily-scale balance indicator line and is slowly continuing its rise toward the MACD line at 1.1770. The Marlin oscillator has entered positive territory

Laurie Bailey 04:57 2025-08-14 UTC+2

GBP/USD Forecast for August 14, 2025

Once again, the British pound has emerged as a leader in the currency market during the rise in stock indexes, showing strong risk appetite. However, we will see the consequences

Laurie Bailey 04:57 2025-08-14 UTC+2

EUR/JPY Forecast for August 14, 2025

We continue to view the EUR/JPY currency pair as an indicator of stock market investor sentiment. At the moment, we see that the price has "changed its mind" about retesting

Laurie Bailey 04:57 2025-08-14 UTC+2

Trading Signals for EUR/USD for August 13-16, 2025: sell below 1.1730 (200 EMA - 8/8 Murray)

The Eagle indicator has reached strong overbought levels, so we will look for opportunities to sell the euro in the coming days, with targets at 1.1596 and possibly even reaching

Dimitrios Zappas 18:09 2025-08-13 UTC+2

Trading Signals for BITCOIN for August 13-16, 2025: sell below $122,100 (7/8 Murray - 21 SMA)

Bitcoin made a strong bullish move during the American session, reaching the $122,200 level, a key level last seen on August 9. Since then, we have observed that

Dimitrios Zappas 18:02 2025-08-13 UTC+2

Trading Signals for GOLD (XAU/USD) for August 13-16, 2025: sell below $3,363 (200 EMA - 21 SMA)

Gold is trading around 3,363, bouncing off a low around 3,328. XAU/USD found good support around the bottom of the uptrend channel and has since reached 3,370, however

Dimitrios Zappas 18:00 2025-08-13 UTC+2
Can't speak right now?
Ask your question in the chat.
Widget callback
 

Dear visitor,

Your IP address shows that you are currently located in the USA. If you are a resident of the United States, you are prohibited from using the services of InstaFintech Group including online trading, online transfers, deposit/withdrawal of funds, etc.

If you think you are seeing this message by mistake and your location is not the US, kindly proceed to the website. Otherwise, you must leave the website in order to comply with government restrictions.

Why does your IP address show your location as the USA?

  • - you are using a VPN provided by a hosting company based in the United States;
  • - your IP does not have proper WHOIS records;
  • - an error occurred in the WHOIS geolocation database.

Please confirm whether you are a US resident or not by clicking the relevant button below. If you choose the wrong option, being a US resident, you will not be able to open an account with InstaForex anyway.

We are sorry for any inconvenience caused by this message.