empty
01.06.2023 09:58 AM
GBP/USD trading plan for European session on June 1, 2023. COT report and overview of yesterday's trades. The pound is back to weekly highs

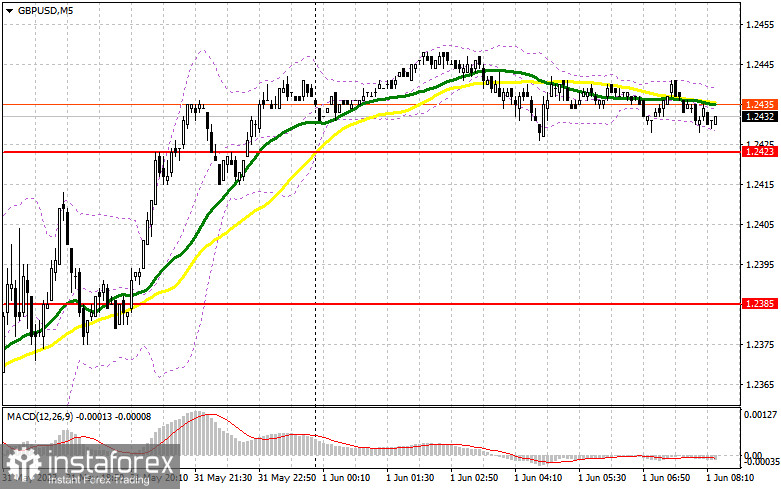
Yesterday there was only one signal to enter the market. Let's have a look at the 5-minute chart and see what happened there. In my morning review, I mentioned the level of 1.2362 as a possible entry point. A fall and false breakout through the mark produced a buy signal. Unfortunately, the pair did not rise. As a result, I got out of the market with minimal losses after breaching 1.2362 again and trading around that level. In the second half of the day, no entry signals were generated.

This image is no longer relevant

For long positions on GBP/USD:

The pound managed to withstand the pressure and returned to the weekly highs after the statements of Federal Reserve officials that the US central bank could skip raising interest rates in June. This morning the focus will be on the UK Manufacturing PMI, which might disappoint traders, as well as the Net Lending to Individuals MoM, which are rather important for the economy.

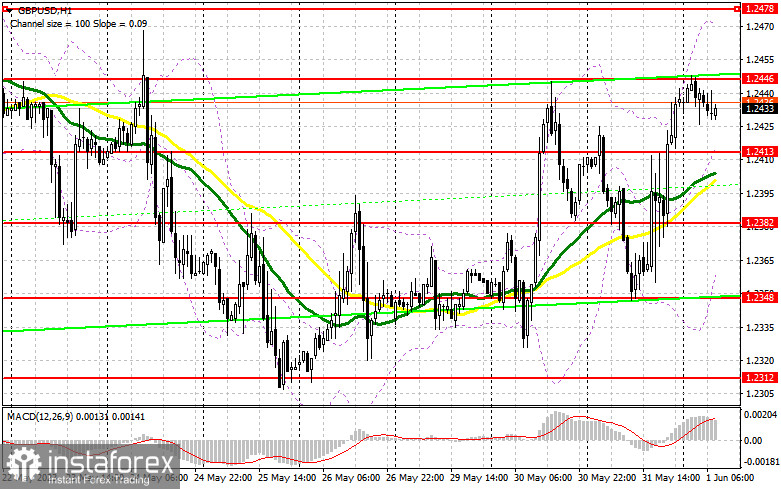
Considering that I do not expect anything good from the data, I expect the pound to be under pressure and the buyers active around 1.2413. Below this mark are the bullish moving averages, so protecting this level and a false breakout would generate a great buy signal. The next target is the 1.2446 resistance, which was tested twice this week. A breakout and consolidation above this range will produce another buy signal with a pullback to 1.2478. The most distant target stands at 1.2506 where I will lock in profit.

If GBP/USD falls and there is no bullish activity at 1.2413,, the pound will face pressure, which will allow bears to win back all yesterday's growth. Therefore, it would be wiser to buy at 1.2382 after a false breakout only. I will buy GBP/USD on a rebound from 1.2348, allowing a correction of 30-35 pips intraday.

For short positions on GBP/USD:

The bulls struck quite a powerful blow to the sellers' stop-orders yesterday and now they have the chance to continue the correction. Therefore, I would expect new sellers to appear around the new resistance level of 1.2446. A failed consolidation above that range will produce a sell signal, and the pair could fall to 1.2413, a new support level, which can change the balance of forces. A break and an upside retest of this range will create a sell entry point with the target at 1.2382. The most distant target stands at 1.2348 where I will lock in profit.

If GBP/USD goes up and there is no bearish activity at 1.2446, it is better to hold back from short positions until the test of a larger resistance at 1.2478. In such a case, a false breakout through this mark will create a sell entry point. If there is no activity there either, I will sell GBP/USD at 1.2506, allowing a bearish correction of 30-35 pips intraday.

This image is no longer relevant

COT report:

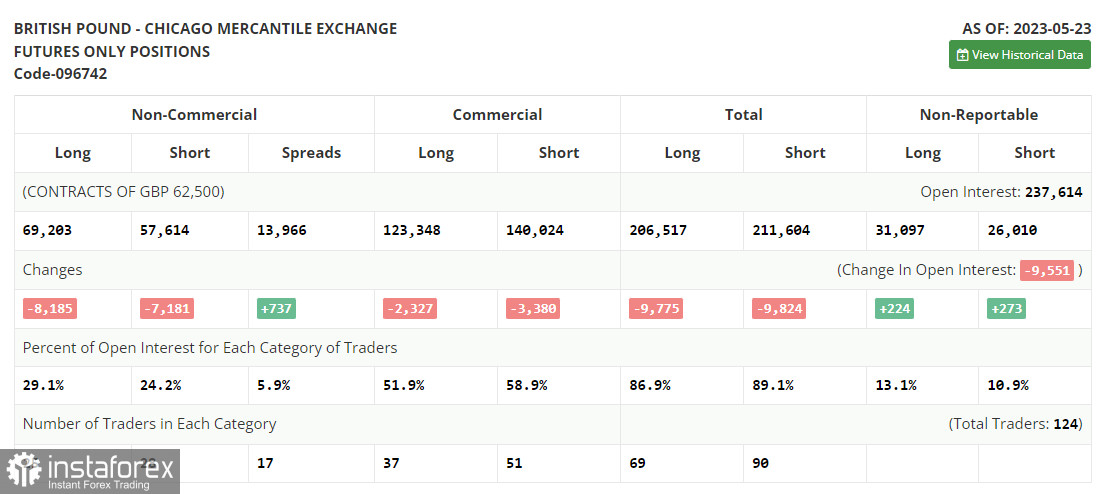
According to the COT report for May 23, the number of long and short positions decreased. Last week, the pound was bearish. Fearing a default and a recession in the US, traders had to close positions, especially in the face of uncertainty surrounding the Bank of England's monetary policy stance. The regulator hinted at a pause in rate hikes. However, with high inflationary pressures in the UK, it seems unlikely. The COT report showed that non-commercial short positions dropped by 7,181 to 57,614, and non-commercial long positions fell by 8,185 to 69,203. The overall non-commercial net position came in at 11,059 versus 12,593 a week earlier. The weekly closing price fell to 1.2425 from 1.2495.

This image is no longer relevant

Indicator signals:

Moving Averages

Trading is carried out above the 30-day and 50-day moving averages, which indicates that the pound will continue to rise.

Please note that the time period and levels of the moving averages are analyzed only for the H1 chart, which differs from the general definition of the classic daily moving averages on the D1 chart.

Bollinger Bands

If the pair falls, the lower band of the indicator at 1.2365 will act as support.

Description of indicators:

• A moving average of a 50-day period determines the current trend by smoothing volatility and noise; marked in yellow on the chart;

• A moving average of a 30-day period determines the current trend by smoothing volatility and noise; marked in green on the chart;

• MACD Indicator (Moving Average Convergence/Divergence) Fast EMA with a 12-day period; Slow EMA with a 26-day period. SMA with a 9-day period;

• Bollinger Bands: 20-day period;

• Non-commercial traders are speculators such as individual traders, hedge funds, and large institutions who use the futures market for speculative purposes and meet certain requirements;

• Long non-commercial positions represent the total number of long positions opened by non-commercial traders;

• Short non-commercial positions represent the total number of short positions opened by non-commercial traders;

• The non-commercial net position is the difference between short and long positions of non-commercial traders.

Miroslaw Bawulski,
Analytical expert of InstaForex
© 2007-2025
Select timeframe
5
min
15
min
30
min
1
hour
4
hours
1
day
1
week
Earn on cryptocurrency rate changes with InstaForex
Download MetaTrader 4 and open your first trade
  • Grand Choice
    Contest by
    InstaForex
    InstaForex always strives to help you
    fulfill your biggest dreams.
    JOIN CONTEST

Recommended Stories

How to Trade the GBP/USD Pair on May 16? Simple Tips and Trade Analysis for Beginners

Analysis of Thursday's Trades 1H Chart of GBP/USD On Thursday, the GBP/USD pair showed minimal upward movement; however, the 5-minute timeframe indicates this was largely a sideways move

Paolo Greco 06:17 2025-05-16 UTC+2

How to Trade the EUR/USD Pair on May 16? Simple Tips and Trade Analysis for Beginners

Analysis of Thursday's Trades 1H Chart of EUR/USD The EUR/USD currency pair traded in both directions throughout Thursday. The macroeconomic background was rich, but it had no decisive impact

Paolo Greco 06:17 2025-05-16 UTC+2

Trading Recommendations and Analysis for GBP/USD on May 16: The Pound Decided to Take a Break

On Thursday, the GBP/USD currency pair traded strictly sideways with low volatility. Despite a busy macroeconomic calendar, the market ignored most of the data, just as anticipated

Paolo Greco 03:54 2025-05-16 UTC+2

Trading Recommendations and Analysis for EUR/USD on May 16: The Market Has Once Again Confirmed the Obvious

On Thursday, the EUR/USD currency pair showed only one thing—a complete unwillingness to move. We observed sideways movement throughout the day despite a fairly packed macroeconomic calendar. However, as mentioned

Paolo Greco 03:54 2025-05-16 UTC+2

How to Trade the GBP/USD Pair on May 15? Simple Tips and Trade Analysis for Beginners

Analysis of Wednesday's Trades 1H Chart of GBP/USD The GBP/USD pair continued its upward movement throughout Wednesday, despite the absence of any specific fundamental reasons. The day before, a U.S

Paolo Greco 06:21 2025-05-15 UTC+2

How to Trade the EUR/USD Pair on May 15? Simple Tips and Trade Analysis for Beginners

Analysis of Wednesday's Trades 1H Chart of EUR/USD The EUR/USD currency pair experienced upward movement for approximately half of Wednesday. The latest "surge" in the euro was particularly "impressive," although

Paolo Greco 06:21 2025-05-15 UTC+2

Trading Recommendations and Analysis for GBP/USD on May 15: The Roller Coaster Begins

On Wednesday, the GBP/USD currency pair continued trading with an upward bias for some time, but it resumed its decline in the afternoon. From our perspective, the U.S. dollar

Paolo Greco 03:41 2025-05-15 UTC+2

Trading Recommendations and Analysis for EUR/USD on May 15: Heading Down Again or Waiting for Trump?

The EUR/USD currency pair continued upward movement on Wednesday, but only briefly. In the afternoon, the euro started to decline, despite the lack of macroeconomic factors supporting such moves. Donald

Paolo Greco 03:41 2025-05-15 UTC+2

How to Trade the GBP/USD Pair on May 14? Simple Tips and Trade Analysis for Beginners

Analysis of Tuesday's Trades 1H Chart of GBP/USD On Tuesday, the GBP/USD pair experienced significant growth, despite no clear catalyst behind it. On Monday, the dollar rose on specific grounds

Paolo Greco 06:11 2025-05-14 UTC+2

How to Trade the EUR/USD Pair on May 14? Simple Tips and Trade Analysis for Beginners

Analysis of Tuesday's Trades 1H Chart of EUR/USD On Tuesday, the EUR/USD currency pair nearly fully recovered from Monday's decline. As reality has shown, strong reasons are required

Paolo Greco 06:11 2025-05-14 UTC+2
Can't speak right now?
Ask your question in the chat.
Widget callback
 

Dear visitor,

Your IP address shows that you are currently located in the USA. If you are a resident of the United States, you are prohibited from using the services of InstaFintech Group including online trading, online transfers, deposit/withdrawal of funds, etc.

If you think you are seeing this message by mistake and your location is not the US, kindly proceed to the website. Otherwise, you must leave the website in order to comply with government restrictions.

Why does your IP address show your location as the USA?

  • - you are using a VPN provided by a hosting company based in the United States;
  • - your IP does not have proper WHOIS records;
  • - an error occurred in the WHOIS geolocation database.

Please confirm whether you are a US resident or not by clicking the relevant button below. If you choose the wrong option, being a US resident, you will not be able to open an account with InstaForex anyway.

We are sorry for any inconvenience caused by this message.