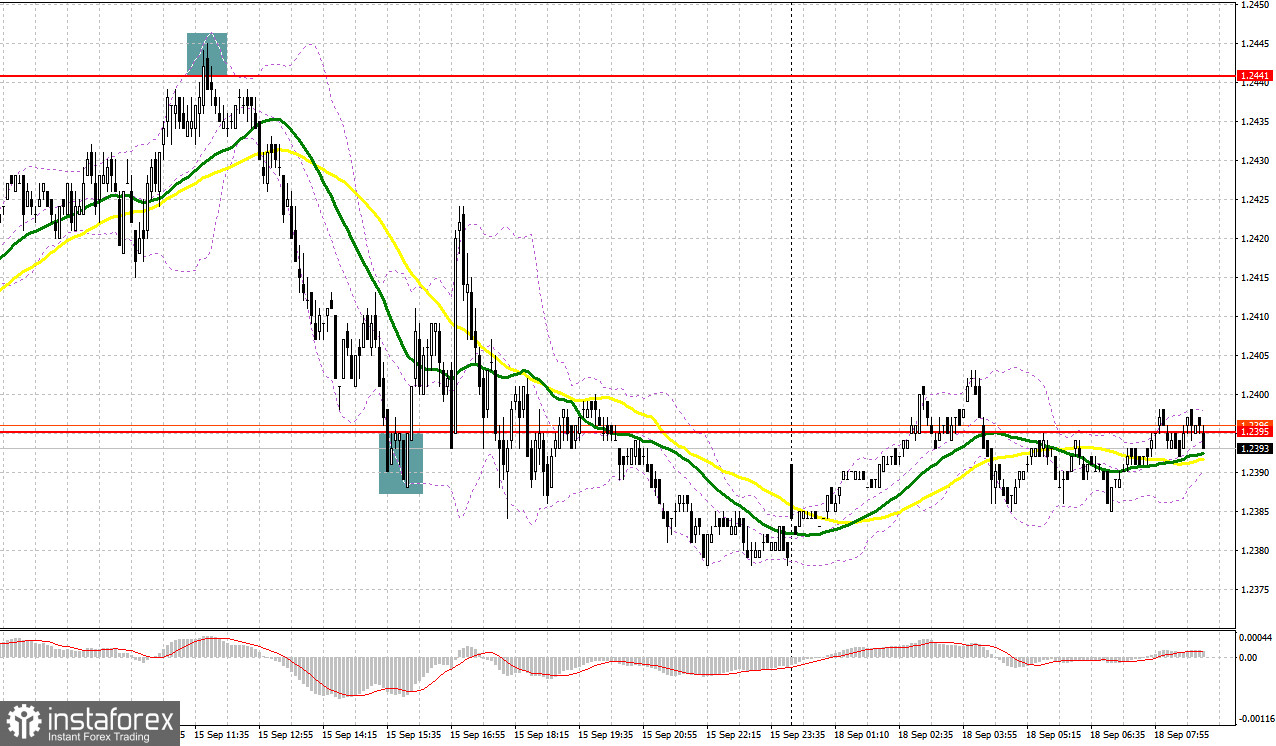
There were a couple of great market entry signals on Friday. Let's see what happened on the 5-minute chart. In my morning review, I mentioned the level of 1.2441 as a possible entry point. A rise and a false breakout at 1.2451 generated a sell signal. As a result, the pair fell by almost 50 pips. In the afternoon, safeguarding 1.2395 resulted in a 25-pip rise.
For long positions on GBP/USD:
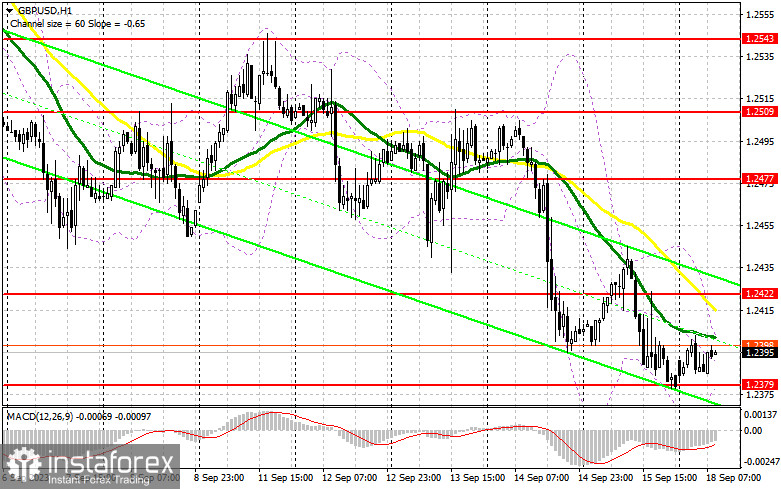
This week everything will depend on the UK inflation data and the decision of the Bank of England, which could further hurt the pound and fuel the bearish market. But we will talk more about this closer to the events themselves. No UK reports scheduled for today, so GBP buyers will get a chance to correct higher similar to the one we saw last Friday. But given that market expectations have shifted towards the Federal Reserve's further tightening of monetary policy, it is unlikely for major players to buy the pound even at such attractive prices. Due to this, I intend to act on dips only after a false breakout near the new monthly low of 1.2379. This would serve as a buy signal, aiming for an update of 1.2422. Slightly below this level are the moving averages, so the bulls will face problems there. A breakout and consolidation above this range will boost buyers' confidence, suggesting long positions and preserving chances to reach 1.2478. This is where large sellers may step in. The higher target would be the 1.2509 area, where I plan to take profits. If GBP/USD declines and a lack of activity at 1.2379, the pressure on the pound will increase again, which will open the way to new monthly lows. In such a case, only the defense of the next area at 1.2340 and a false breakout there will signal opening long positions. I plan to buy GBP/USD immediately on a dip only from the 1.2312 low, bearing in mind an intraday correction of 30-35 pips.
For short positions on GBP/USD:
The bears need to defend the nearest resistance at 1.2422, as well as take control of the new low at 1.2379. In the absence of influential fundamental reports, I will act on 1.2422 only after unsuccessful consolidation, which will signal a sell opportunity. GBP/USD may decline towards 1.2379. A breakout and an upward retest of this range will deal a more serious blow to the bulls' positions, providing an opportunity to fall to the support at 1.2340. A more distant target remains a low of 1.2312, where I will take profits. If the pair rises and we see weak trading at 1.2422, the buyers will get a chance to correct at the beginning of the week. In this case, I will postpone selling until a false breakout at 1.2478. If downward movement stalls there, one can sell the British pound on a bounce from 1.2509, bearing in mind a 30-35-pips downward intraday correction.
COT report:
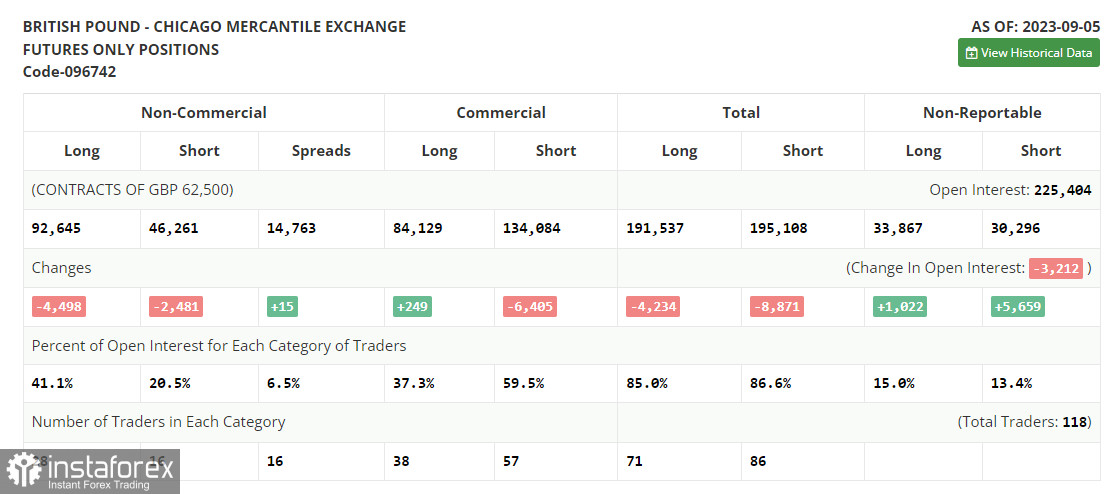
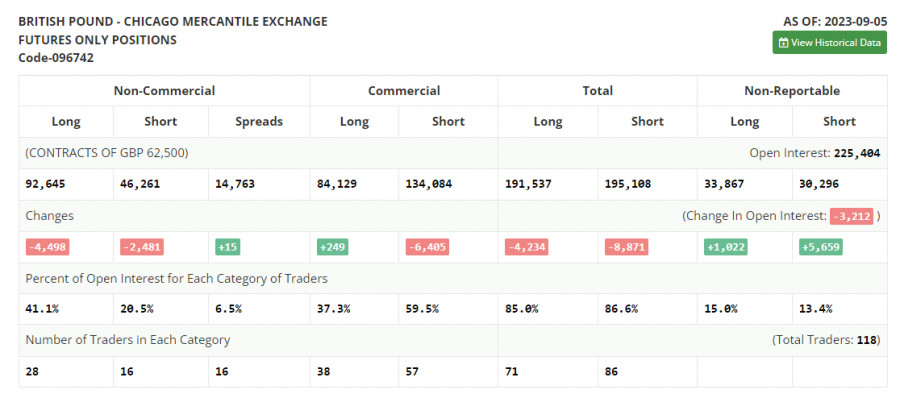
In the COT report (Commitment of Traders) for September 5, there was a reduction in both long and short positions. Remarks by Bank of England Governor Andrew Bailey certainly caused quite a stir, and the pound dropped further as a result. Buyers were not pleased with Bailey's hints at an end of the currency cycle of policy tightening, as it is evident that the US Federal Reserve, which has made more progress in combating inflation, has no intention of doing so. The difference in central bank policies maintains the dollar's appeal and exerts downward pressure on the pound. However, this could benefit the buyers. Indeed, the lower the pound, the more attractive it becomes for medium-term buying. The latest COT report indicates that non-commercial long positions decreased only by 4,498 to the level of 92,645, while non-commercial short positions fell by 2,481 to 46,261. As a result, the spread between long and short positions only increased by 15. GBP/USD closed last week lower at 1.2567 versus 1.2624 a week ago.
Indicator signals:
Moving Averages
The instrument is trading below the 30 and 50-day moving averages. It indicates a possible decline in GBP/USD.
Please note that the time period and levels of the moving averages are analyzed only for the H1 chart, which differs from the general definition of the classic daily moving averages on the D1 chart.
Bollinger Bands
In case of a decline, the lower band of the indicator near 1.2379 will act as support.
Description of indicators:
• A moving average of a 50-day period determines the current trend by smoothing volatility and noise; marked in yellow on the chart;
• A moving average of a 30-day period determines the current trend by smoothing volatility and noise; marked in green on the chart;
• MACD Indicator (Moving Average Convergence/Divergence) Fast EMA with a 12-day period; Slow EMA with a 26-day period. SMA with a 9-day period;
• Bollinger Bands: 20-day period;
• Non-commercial traders are speculators such as individual traders, hedge funds, and large institutions who use the futures market for speculative purposes and meet certain requirements;
• Long non-commercial positions represent the total number of long positions opened by non-commercial traders;
• Short non-commercial positions represent the total number of short positions opened by non-commercial traders;
• The non-commercial net position is the difference between short and long positions of non-commercial traders.