empty
03.10.2023 06:46 AM
Forecast for EUR/USD on October 3, 2023

EUR/USD

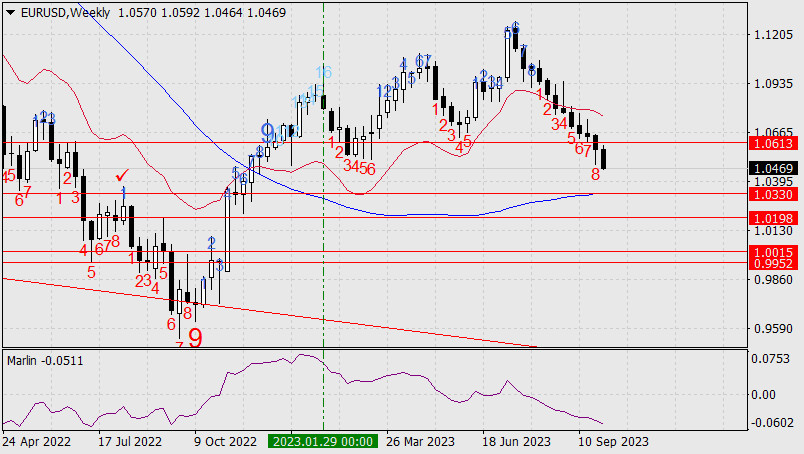
Unfortunately, the dollar did not directly correlate with the stock market, continuing its choppy corrective fall. Now, the correlation has become typical during the crisis, especially when taking into account falling bonds and oil prices. The euro has been declining for 12 consecutive weeks, which is already a record for the single currency.

This image is no longer relevant

But what does the Sequential indicator show us? It indicates that the pair may continue to fall for another week, and a reversal may occur after the 13th week of decline according to this indicator's algorithm. In January 2023, the reversal occurred even after the 16th week of growth. Here, we see that the nearest reversal (from the 9th candle) may occur from the level of 1.0330 (MACD line), and if the count of descending candles continues, then it would be from the level of 1.0198 (the peak of August 2022). In this scenario, the correction could be so deep that the bar count starts again from one, which would mean that the euro will fall significantly below parity.

This image is no longer relevant

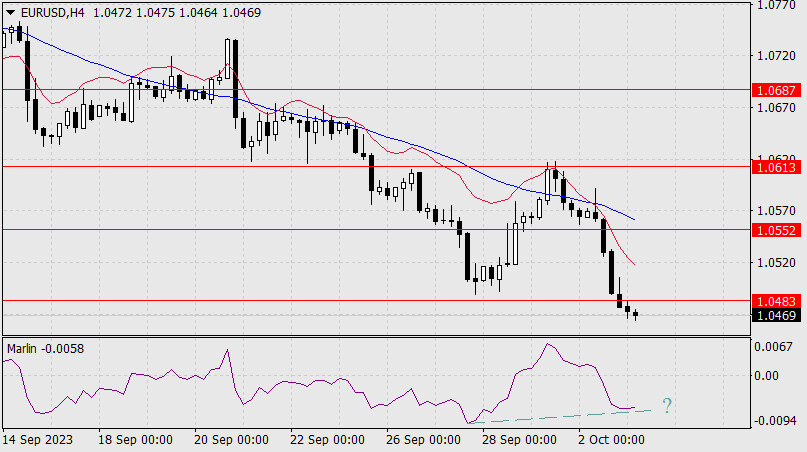
The current corrective structure of the decline is becoming increasingly deceptive. Now, on the daily chart, the price has fallen below the support level of 1.0483 and the embedded price channel line. To completely eliminate the signs of a reversal, the Marlin oscillator needs to move below the converging line to break the convergence and make it invalid. Formally, the 1.0410 target is already open.

This image is no longer relevant

On the 4-hour chart, the price is declining below both indicator lines, and Marlin is decreasing in the negative territory. There is a possibility of forming a convergence if the price consolidates above 1.0483. A bearish trend.

Laurie Bailey,
Analytical expert of InstaForex
© 2007-2025
Select timeframe
5
min
15
min
30
min
1
hour
4
hours
1
day
1
week
Earn on cryptocurrency rate changes with InstaForex
Download MetaTrader 4 and open your first trade
  • Grand Choice
    Contest by
    InstaForex
    InstaForex always strives to help you
    fulfill your biggest dreams.
    JOIN CONTEST

Recommended Stories

Forecast for GBP/USD on May 19, 2025

On the hourly chart, the GBP/USD pair continued to move sideways on Friday, fluctuating between the levels of 1.3205 and 1.3344. Following a rejection from the resistance zone of 1.3344–1.3357

Samir Klishi 10:36 2025-05-19 UTC+2

Technical Analysis of Intraday Price Movement of Gold Commodity Instrument, Monday May 19, 2025.

On the 4-hour chart, the Stochastic Oscillator indicator appears to be crossing BUY, coupled with the price movement moving above the WMA (21) and the appearance of a Bullish

Arief Makmur 07:58 2025-05-19 UTC+2

Technical Analysis of Intraday Price Movement of EUR/JPY Cross Currency Pairs, Monday May 19, 2025.

Although Sellers still dominate EUR/JPY on its 4-hour chart, this is confirmed by its price movement which is moving below the WMA (21) which also has a downward slope

Arief Makmur 07:58 2025-05-19 UTC+2

EUR/USD Forecast for May 19, 2025

On Friday, the euro failed to sustain its upward movement, but it also didn't fall below the daily-scale MACD indicator line—the day closed with a black candlestick, but still above

Laurie Bailey 07:00 2025-05-19 UTC+2

GBP/USD Forecast for May 19, 2025

On Friday, the British pound failed to break above the resistance level 1.3311. Even the "head and shoulders" pattern on the Marlin oscillator couldn't help—the price extended its sideways movement

Laurie Bailey 07:00 2025-05-19 UTC+2

USD/JPY Forecast for May 19, 2025

As of this morning, the USD/JPY pair has settled near a strong support level—the intersection of the MACD line with the target level at 145.08. If the price intends

Laurie Bailey 07:00 2025-05-19 UTC+2

Trading Signals for EUR/USD for May 16-19, 2025: sell below 1.1230 (200 EMA - 6/8 Murray)

Early in the American session, the EUR/USD pair is trading around 1.1178, below the 200 EMA, and below the 21 SMA under bearish pressure. Having reached the 1.1270 area

Dimitrios Zappas 17:04 2025-05-16 UTC+2

Trading Signals for GOLD for May 16-19, 2025: sell below $3,211 -3,226 (200 EMA - 21 SMA)

The Eagle indicator is reaching oversold levels, so we believe that any pullback, as long as the gold price remains above the 4/8 Murray level, will be seen

Dimitrios Zappas 17:02 2025-05-16 UTC+2

USD/CAD. Analysis and Forecast

As of Friday, the USD/CAD pair is under pressure for the second consecutive day, driven by a combination of negative factors. Yesterday's weaker-than-expected U.S. macroeconomic data reinforced market expectations

Irina Yanina 11:28 2025-05-16 UTC+2

Forex forecast 16/05/2025: EUR/USD, USD/JPY, USD/CAD, Gold, Oil and Bitcoin

Useful links: My other articles are available in this section InstaForex course for beginners Popular Analytics Open trading account Important: The begginers in forex trading need to be very careful

Sebastian Seliga 11:08 2025-05-16 UTC+2
Can't speak right now?
Ask your question in the chat.
Widget callback
 

Dear visitor,

Your IP address shows that you are currently located in the USA. If you are a resident of the United States, you are prohibited from using the services of InstaFintech Group including online trading, online transfers, deposit/withdrawal of funds, etc.

If you think you are seeing this message by mistake and your location is not the US, kindly proceed to the website. Otherwise, you must leave the website in order to comply with government restrictions.

Why does your IP address show your location as the USA?

  • - you are using a VPN provided by a hosting company based in the United States;
  • - your IP does not have proper WHOIS records;
  • - an error occurred in the WHOIS geolocation database.

Please confirm whether you are a US resident or not by clicking the relevant button below. If you choose the wrong option, being a US resident, you will not be able to open an account with InstaForex anyway.

We are sorry for any inconvenience caused by this message.