empty
26.03.2024 04:37 PM
U.S. Dollar Index: trading scenarios on March 26, 2024

This image is no longer relevant

At the beginning of the week, the last in this month and quarter, the dollar is slightly losing its positions, declining for the second trading day from the local 4-week high of 104.20 reached last week.

Market and economists' expectations regarding the start of the Fed's monetary policy easing have shifted mainly to the second half of the year.

However, if inflation continues to accelerate and the U.S. economy and labor market demonstrate the same resilience, the start of the Fed's monetary policy easing cycle may be pushed even further into the future, perhaps even to the next year. This, in turn, will provide support to the dollar.

This image is no longer relevant

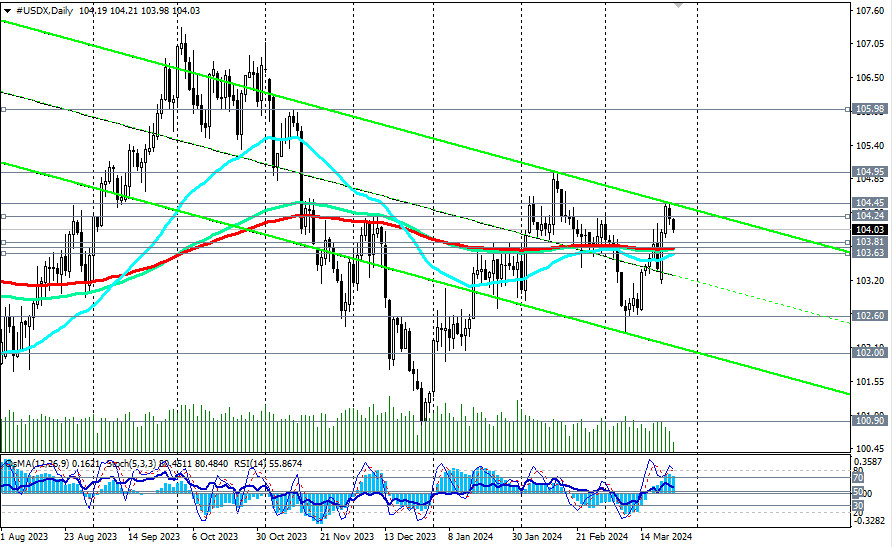
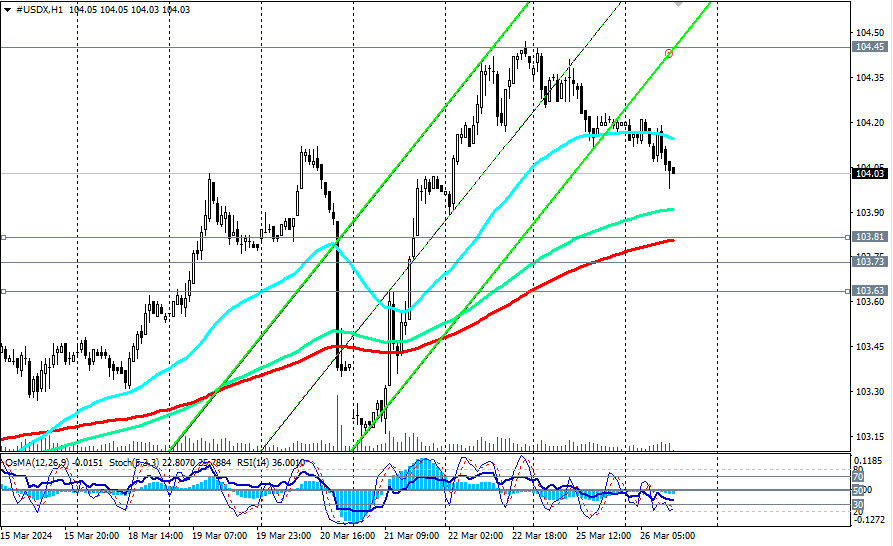
As of writing, the dollar index (CFD #USDX in the MT4 terminal) was trading near the 104.00 mark, declining towards the support zone around the levels of 103.81 (200 EMA on the 1-hour chart), 103.73 (200 EMA on the daily chart), 103.63 (200 EMA on the 4-hour chart).

If today's macroeconomic statistics from the U.S. at the beginning of the American trading session turn out to be weak, then we should expect the above-mentioned support levels to be reached.

This image is no longer relevant

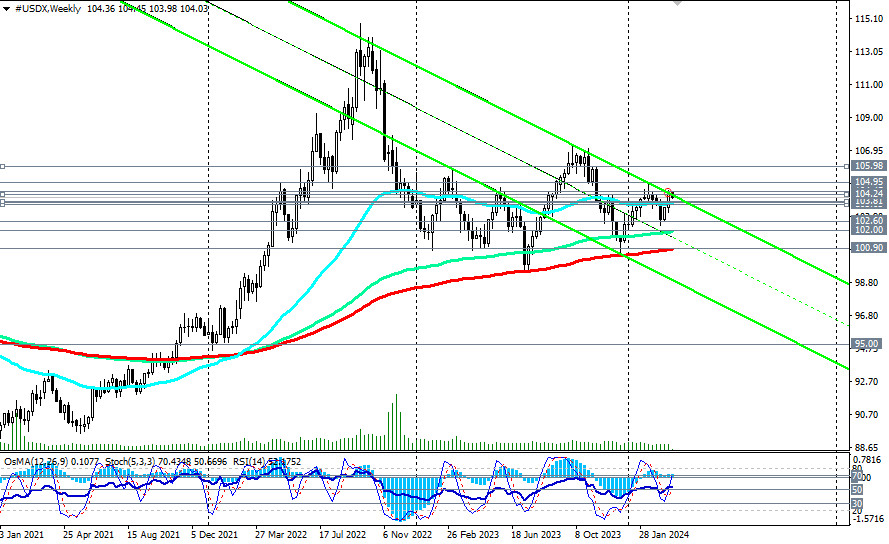
In turn, their breakdown may signal an increase in short positions with targets at key support levels of 102.00 (144 EMA on the weekly chart), 100.90 (200 EMA on the weekly chart), 100.00, still separating the long-term bullish market from the bearish one and making long-term long positions preferable.

In an alternative scenario, the first signal for new purchases here may be the breakout of the local resistance level of 104.24, and the breakout of the local resistance level of 104.45 (upper boundary of the downward channel on the weekly chart) will confirm this.

Here, the growth target may be the local resistance level of 104.95 and the level of 105.00.

Support levels: 104.00, 103.81, 103.73, 103.63, 103.00, 102.60, 102.30, 102.00, 101.90, 101.00, 100.90, 100.00

Resistance levels: 104.24, 104.45, 104.95, 105.00, 106.00, 106.80, 107.00, 107.30

Trading Scenarios

Alternative scenario: Buy Stop 104.30. Stop-Loss 103.90. Targets 104.45, 104.95, 105.00, 106.00, 106.80, 107.00, 107.30

Main scenario: Sell Stop 103.90. Stop-Loss 104.30. Targets 103.81, 103.73, 103.63, 103.00, 102.60, 102.30, 102.00, 101.90, 101.00, 100.90, 100.00

"Targets" correspond to support/resistance levels. This also does not mean that they will necessarily be reached, but they can serve as a guide when planning and placing your trading positions.

Jurij Tolin,
Analytical expert of InstaForex
© 2007-2025
Summary
Urgency
Analytic
Jurij Tolin
Start trade
Earn on cryptocurrency rate changes with InstaForex
Download MetaTrader 4 and open your first trade
  • Chancy Deposit
    Deposit your account with $3,000 and get $4000 more!
    In July we raffle $4000 within the Chancy Deposit campaign!
    Get a chance to win by depositing $3,000 to a trading account. Having fulfilled this condition, you become a campaign participant.
    JOIN CONTEST

Recommended Stories

How to Trade the GBP/USD Pair on July 28? Simple Tips and Trade Analysis for Beginners

Analysis of Friday's Trades 1H Chart of GBP/USD On Friday, the GBP/USD pair continued its decline, which began on Thursday. First, we would like to point out that the fall

Paolo Greco 07:25 2025-07-28 UTC+2

How to Trade the EUR/USD Pair on July 28? Simple Tips and Trade Analysis for Beginners

Analysis of Friday's Trades 1H Chart of EUR/USD On Friday, the EUR/USD currency pair traded with minimal decline. By the end of the day, the euro had settled below

Paolo Greco 06:18 2025-07-28 UTC+2

Trading Recommendations and Trade Breakdown for GBP/USD on July 28: The Pound Plunged Sharply but Hasn't Lost Its Momentum

On Friday, the GBP/USD currency pair was trading in a downtrend. The price easily broke through the Senkou Span B and Kijun-sen lines, as well as worked through the 1.3420

Paolo Greco 03:48 2025-07-28 UTC+2

Trading Recommendations and Trade Breakdown for EUR/USD on July 28: The Ideal, Strong Euro

On Friday, the EUR/USD currency pair once again traded with low volatility but demonstrated nearly perfect technical behavior. There was little news during the day, with the only noteworthy report

Paolo Greco 03:48 2025-07-28 UTC+2

How to Trade the GBP/USD Pair on July 25? Simple Tips and Trade Analysis for Beginners

Analysis of Thursday's Trades 1H Chart of GBP/USD On Thursday, the GBP/USD pair exhibited a relatively strong decline, triggered by weak business activity indices in the UK. However, this explanation

Paolo Greco 06:43 2025-07-25 UTC+2

How to Trade the EUR/USD Pair on July 25? Simple Tips and Trade Analysis for Beginners

Analysis of Thursday's Trades 1H Chart of EUR/USD The EUR/USD currency pair showed no significant movements on Thursday and remained in low volatility, despite it being the most eventful

Paolo Greco 06:43 2025-07-25 UTC+2

Trading Recommendations and Trade Breakdown for GBP/USD on July 25: The Pound Finds Time for a Correction

On Thursday, the GBP/USD currency pair traded lower, which can be considered a local correction. This movement will cease to be a correction only if the price consolidates below

Paolo Greco 04:17 2025-07-25 UTC+2

Trading Recommendations and Trade Breakdown for EUR/USD on July 25: The Market Wanders Aimlessly

On Thursday, the EUR/USD currency pair exhibited astonishingly low volatility and a complete unwillingness to move in any clear direction. Many traders were expecting active movements during

Paolo Greco 04:17 2025-07-25 UTC+2

How to Trade the GBP/USD Pair on July 24? Simple Tips and Trade Analysis for Beginners

Analysis of Wednesday's Trades 1H Chart of GBP/USD The GBP/USD pair also continued its upward movement on Wednesday. As expected, this happened without the need for any news or reports

Paolo Greco 07:12 2025-07-24 UTC+2

How to Trade the EUR/USD Pair on July 24? Simple Tips and Trade Analysis for Beginners

Analysis of Wednesday's Trades 1H Chart of EUR/USD On Wednesday, the EUR/USD currency pair continued its upward movement. Essentially, we are seeing the same pattern every day this week —

Paolo Greco 07:12 2025-07-24 UTC+2
Can't speak right now?
Ask your question in the chat.
Widget callback
 

Dear visitor,

Your IP address shows that you are currently located in the USA. If you are a resident of the United States, you are prohibited from using the services of InstaFintech Group including online trading, online transfers, deposit/withdrawal of funds, etc.

If you think you are seeing this message by mistake and your location is not the US, kindly proceed to the website. Otherwise, you must leave the website in order to comply with government restrictions.

Why does your IP address show your location as the USA?

  • - you are using a VPN provided by a hosting company based in the United States;
  • - your IP does not have proper WHOIS records;
  • - an error occurred in the WHOIS geolocation database.

Please confirm whether you are a US resident or not by clicking the relevant button below. If you choose the wrong option, being a US resident, you will not be able to open an account with InstaForex anyway.

We are sorry for any inconvenience caused by this message.