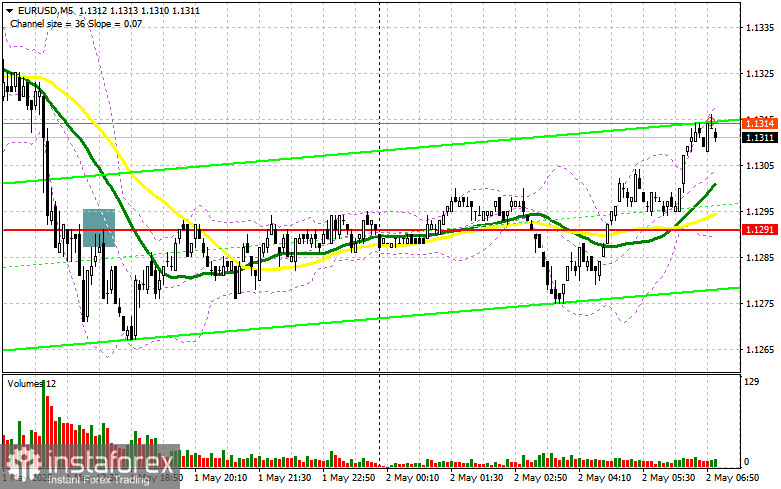
Yesterday, several entry points into the market were formed. Let's look at the 5-minute chart and analyze what happened. In my morning forecast, I highlighted the 1.1320 level as a key point for trade decisions. A decline and a false breakout around 1.1320 provided a good entry for buying euros, leading to a 20-pip gain. In the second half of the day, a breakout and retest of 1.1292 allowed for selling the euro, bringing in another 30 pips of profit.
To Open Long Positions on EUR/USD:
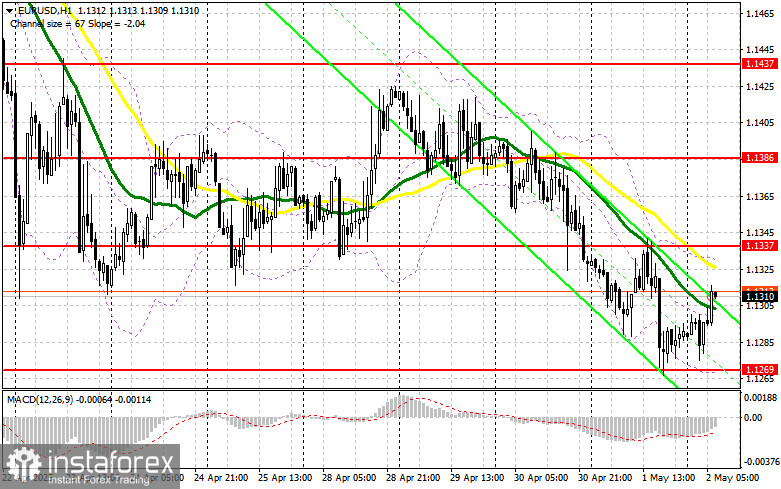
Yesterday's better-than-expected U.S. manufacturing data caused a sharp rise in the dollar, quickly erasing the euro's earlier attempts to recover. Today, many important data from the eurozone will be released, which will determine the pair's next direction. Only very strong reports—such as higher eurozone manufacturing PMIs and a decline in the CPI and unemployment rate—will be enough to restore demand for the pair. The ECB Economic Bulletin will also be in focus. If the pair continues to decline, I will look for a false breakout around the new major support at 1.1269, which would be a good entry point for longs with a target at 1.1337. A breakout and retest of that range would confirm the correct decision to buy euros, aiming for a further rise to 1.1386. The ultimate target is 1.1437, where profits will be taken. Testing this level would nullify sellers' plans to strengthen their positions.
If EUR/USD falls and there's no activity around 1.1269, there's a high risk of a new bearish trend. In this case, sellers may push down to 1.1219. Only a false breakout there would offer a buying opportunity. Otherwise, long positions should be opened only on a bounce from 1.1164, targeting a 30–35-pip intraday correction.
To Open Short Positions on EUR/USD:
Given the expected high volatility in the first half of the day and the break below the lower boundary of the sideways channel, sellers have a real chance to form a new downtrend, which they failed to do yesterday. To achieve this, they must defend the 1.1337 resistance level and show activity there. A false breakout at 1.1337 will signal a sell, aiming for a decline to 1.1269. A breakout of this support could lead to a more significant euro drop. Breaking and holding below 1.1269, followed by a retest from below, would provide another signal to go short, with a target of 1.1219. The final target would be 1.1164, where profits would be taken.
If EUR/USD rises in the first half of the day and bears show no activity around 1.1337, where the moving averages favor sellers, short positions are best postponed until the larger resistance at 1.1386. Selling should be considered only after a failed breakout there. Immediate shorts are planned on a bounce from 1.1437, targeting a 30–35-pip downward correction.
Additional Notes:
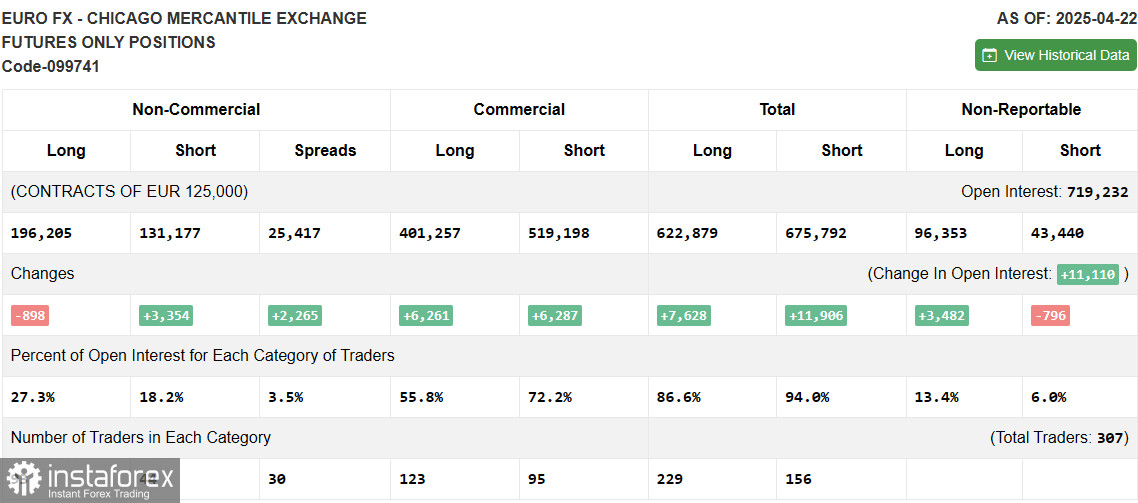
The COT (Commitment of Traders) report for April 22 showed an increase in short positions and a reduction in long positions. Given that the European Central Bank has almost explicitly stated it will continue cutting interest rates, this factor is currently preventing the euro from continuing to rise against the U.S. dollar. Easing measures from Donald Trump and a potential compromise with China on a trade deal are gradually bringing dollar buyers back to the market. Soon, key attention will focus on U.S. economic growth figures for Q1 and the labor market data for April. According to the COT report, long non-commercial positions fell by 898 to 196,205, while short non-commercial positions rose by 3,354 to 131,177. As a result, the spread between long and short positions decreased by 2,493.
Indicator Signals:
Moving Averages
Trading is taking place below the 30- and 50-period moving averages, which indicates a continued decline in the pair.
Note: The author analyzes the moving average periods and prices on the H1 (hourly) chart, which differs from the standard definition of daily moving averages on the D1 (daily) chart.
Bollinger Bands
In the event of a decline, the lower boundary of the indicator near 1.1269 will act as support.
Indicator Definitions:
• Moving Average – defines the current trend by smoothing out volatility and noise. Period: 50. Marked in yellow on the chart.
• Moving Average – defines the current trend by smoothing out volatility and noise. Period: 30. Marked in green on the chart.
• MACD (Moving Average Convergence/Divergence) – shows convergence/divergence of moving averages. Fast EMA: 12-period, Slow EMA: 26-period, Signal SMA: 9-period.
• Bollinger Bands – measures market volatility. Period: 20.
• Non-commercial traders – speculators such as individual traders, hedge funds, and large institutions using the futures market for speculative purposes and meeting certain requirements.
• Long non-commercial positions – the total long open positions non-commercial traders hold.
• Short non-commercial positions – the total short open positions non-commercial traders hold.
• Net non-commercial position – the difference between short and long positions held by non-commercial traders.