empty
08.05.2025 05:09 AM
USD/JPY Forecast for May 8, 2025

USD/JPY

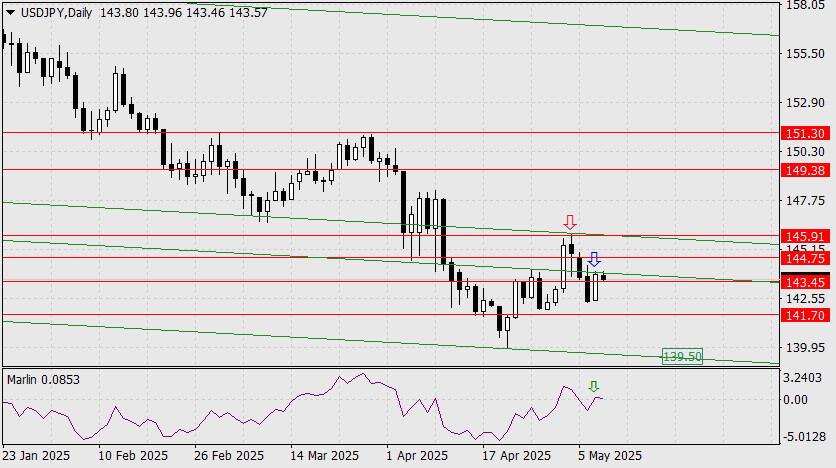
The daily chart shows that the price is reversing downward from the green price channel lines. The first such reversal occurred on May 2, marked by a red arrow, while the second reversal is taking place today at the opening of the trading session (indicated by a blue arrow).

This image is no longer relevant

Moreover, today's reversal is synchronized with a downward reversal of the Marlin oscillator from the zero line. If today's daily candle closes below the 143.45 level, it will open the path toward the nearest target at 141.70, and potentially to the lower boundary of the price channel near the 139.50 mark.

Conversely, a close above yesterday's high at 144.00 would activate an alternative bullish scenario, with potential growth toward 144.75 and a longer-term target at 145.91 — a magnet point formed at the intersection of the channel line with the horizontal level.

This image is no longer relevant

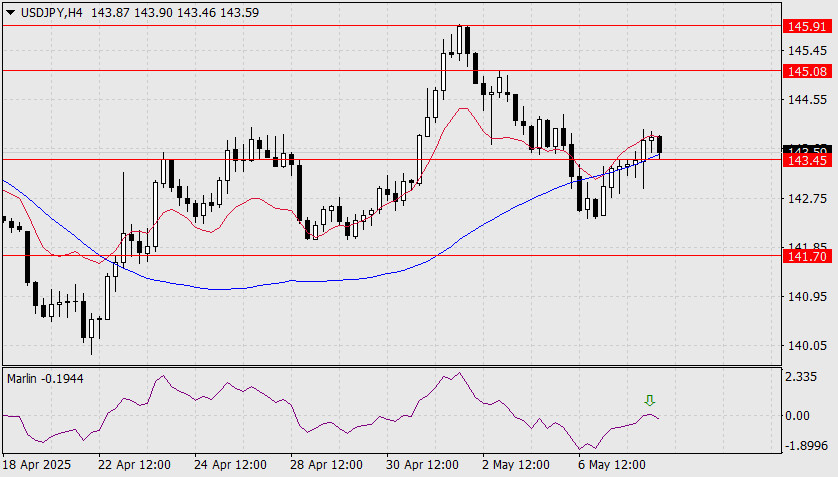
On the four-hour chart, the Marlin oscillator's reversal from the zero line aligns perfectly with the same reversal seen on the daily timeframe. This creates a strong reversal pattern. The price is currently testing support at the MACD line and the key level at 143.45. A firm break below this level would confirm the start of the main bearish scenario for the USD/JPY pair.

Laurie Bailey,
Analytical expert of InstaForex
© 2007-2025
Select timeframe
5
min
15
min
30
min
1
hour
4
hours
1
day
1
week
Earn on cryptocurrency rate changes with InstaForex
Download MetaTrader 4 and open your first trade
  • Grand Choice
    Contest by
    InstaForex
    InstaForex always strives to help you
    fulfill your biggest dreams.
    JOIN CONTEST

Recommended Stories

EUR/USD Forecast for June 20, 2025

EUR/USD In the past 24 hours since the uneventful Federal Reserve meeting, the markets have shed their anxiety and resumed the broader risk-on trend. Even government bond yields are easing

Laurie Bailey 07:16 2025-06-20 UTC+2

AUD/USD Forecast for June 20, 2025

AUD/USD Yesterday, the Australian dollar pierced the MACD line with a lower shadow and nearly tested the support level at 0.6446. This morning's price movement above the MACD line offers

Laurie Bailey 07:16 2025-06-20 UTC+2

GBP/USD Forecast for June 20, 2025

GBP/USD On Wednesday and Thursday, the British pound tried to consolidate below the support level 1.3433 but was unsuccessful. The price is rising steadily, aiming to break above the MACD

Laurie Bailey 07:16 2025-06-20 UTC+2

Trading Signals for GOLD (XAU/USD) for June 19-22, 2025: sell below $3,390 (21 SMA - 8/8 Murray)

Early in the American session, the XAU/USD is trading around 3,370, below the 21 SMA under bearish pressure. We believe a technical rebound could occur in the coming hours

Dimitrios Zappas 15:14 2025-06-19 UTC+2

Trading Signals for EUR/USD for June 19-22, 2025: sell below 1.1535 (21 SMA - 8/8 Murray)

The outlook remains negative for the euro, as rising oil prices could pressure the European currency. In turn, we could expect EUR/USD to reach the 6/8 Murray level at 1.1230

Dimitrios Zappas 14:57 2025-06-19 UTC+2

Forex forecast 19/06/2025: EUR/USD, USD/CHF, GBP/USD, Oil and Bitcoin

Useful links: My other articles are available in this section InstaForex course for beginners Popular Analytics Open trading account Important: The begginers in forex trading need to be very careful

Sebastian Seliga 13:52 2025-06-19 UTC+2

Technical Analysis of Intraday Price Movement EUR/GBP Cross Currency Pairs, Thursday June 19, 2025.

With the movement of the EUR/GBP price on its 4-hour chart moving above the WMA (21) which has a slope that is going upwards and the appearance of convergence between

Arief Makmur 11:45 2025-06-19 UTC+2

Technical Analysis of Daily Price Movement of Nasdaq 100 Index, Thursday June 19, 2025.

Although on its daily chart the Nasdaq 100 index appears to be moving above the WMA (30 Shift 2) which has a slope that is going upwards, but being stuck

Arief Makmur 11:45 2025-06-19 UTC+2

Forecast for EUR/USD on June 19, 2025

On Wednesday, the EUR/USD pair resumed its decline after a short pause and by Thursday morning settled right around the 76.4% Fibonacci retracement level at 1.1454. A rebound from this

Samir Klishi 11:20 2025-06-19 UTC+2

Forecast for GBP/USD on June 19, 2025

On the hourly chart, the GBP/USD pair continued its decline on Tuesday and Wednesday after bouncing off the resistance zone of 1.3611–1.3633 and closed below the support zone of 1.3425–1.3444

Samir Klishi 11:13 2025-06-19 UTC+2
Can't speak right now?
Ask your question in the chat.
Widget callback
 

Dear visitor,

Your IP address shows that you are currently located in the USA. If you are a resident of the United States, you are prohibited from using the services of InstaFintech Group including online trading, online transfers, deposit/withdrawal of funds, etc.

If you think you are seeing this message by mistake and your location is not the US, kindly proceed to the website. Otherwise, you must leave the website in order to comply with government restrictions.

Why does your IP address show your location as the USA?

  • - you are using a VPN provided by a hosting company based in the United States;
  • - your IP does not have proper WHOIS records;
  • - an error occurred in the WHOIS geolocation database.

Please confirm whether you are a US resident or not by clicking the relevant button below. If you choose the wrong option, being a US resident, you will not be able to open an account with InstaForex anyway.

We are sorry for any inconvenience caused by this message.