empty
10.06.2025 10:21 AM
GBP/USD. June 10th. Unemployment Rises in the UK

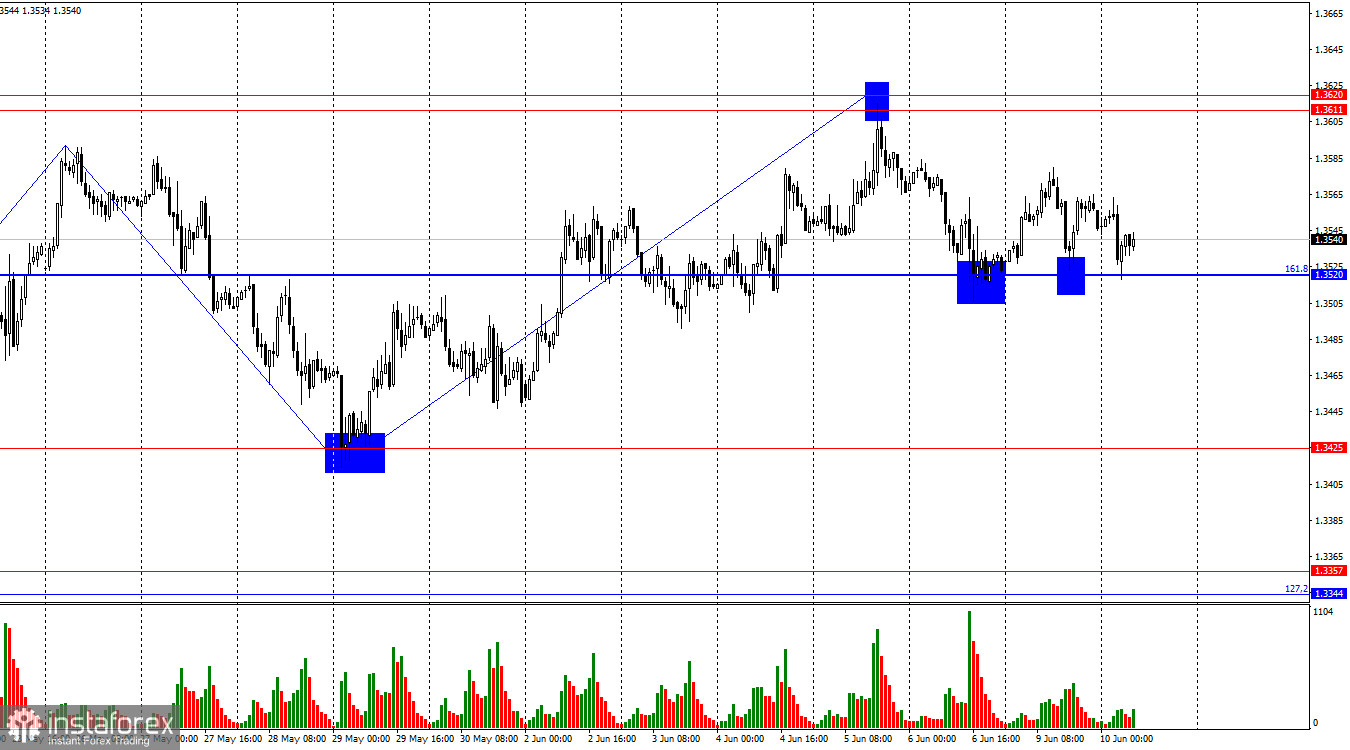
On the hourly chart, the GBP/USD pair on Monday made two rebounds from the 161.8% corrective level at 1.3520 but failed to start an upward movement. Today, on Tuesday, the pair consolidated below this level, allowing for expectations of continued decline toward the 1.3425 level and the support zone of 1.3344–1.3357. Bears unexpectedly launched a sharp offensive.

This image is no longer relevant

The wave pattern clearly points to the continuation of a bullish trend. The most recent upward wave broke through the previous wave's peak, while the most recent downward wave did not break the previous low. Bulls will find it difficult to rely on further growth without new announcements from Donald Trump regarding the increase or imposition of new import tariffs. However, the U.S. President remains ready to raise tariffs and escalate immigration-related actions. Thus, bulls still have reasons to initiate new attacks.

On Monday, the news backdrop was absent, explaining the low trading activity. Today, the situation has turned 180 degrees. In the morning, the UK released reports that, at first glance, did not appear especially significant. Unemployment figures, while important, usually cause only a restrained market reaction. Yet, within less than two hours, the pound lost about 85 points as unemployment rose to 4.6% — exactly as traders had expected. However, the number of unemployed rose by 33,000 in May, three times higher than the anticipated 10,000. This partly triggered the selling of the British pound. The wage growth report showed a 5.3% increase, which indirectly points to slowing inflation and increases the likelihood of further monetary easing by the Bank of England. While it's still too early to talk about another rate cut in the UK, these three reports combined gave bears significant support. In my view, however, the market overreacted — this aggressive bearish move was a surprise, especially considering the market has barely sold the pair even on stronger news in the past four months.

This image is no longer relevant

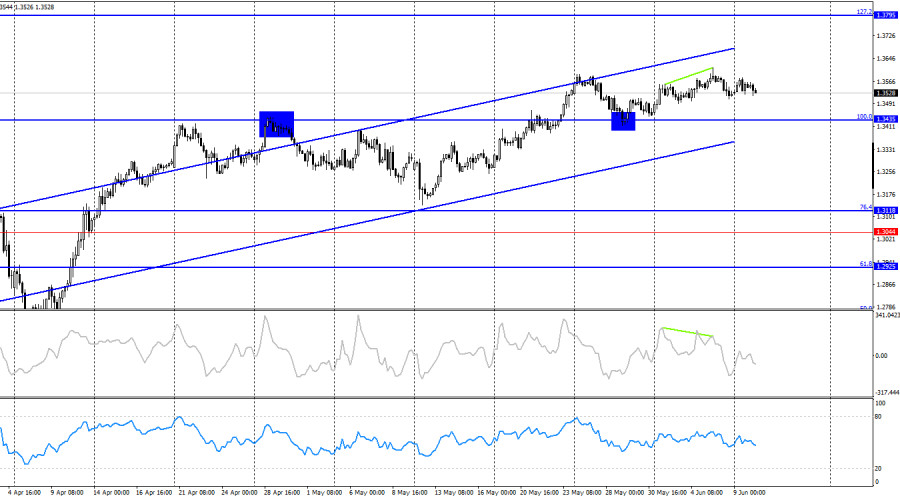
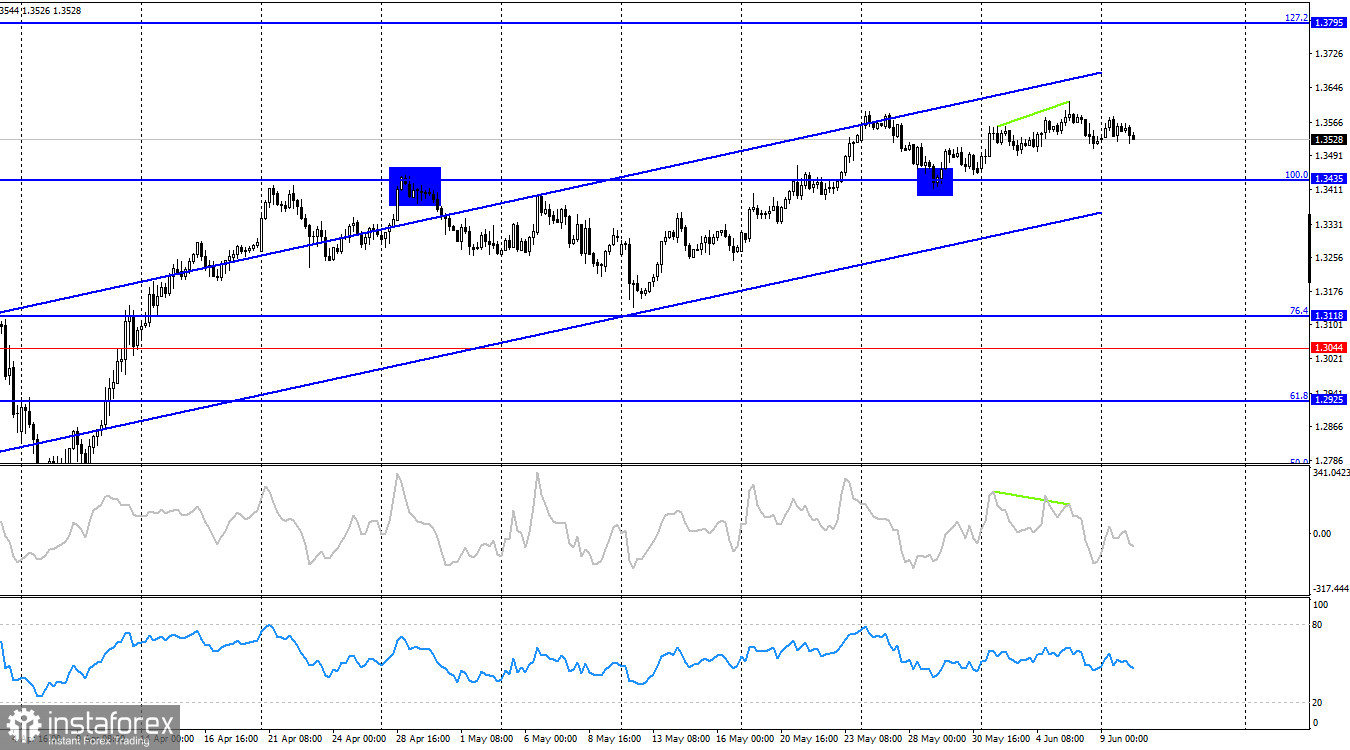
On the 4-hour chart, the pair previously consolidated above the 100.0% Fibonacci level at 1.3435 and rebounded from it from above. However, a renewed upward move toward the 127.2% correction level at 1.3795 is possible if there is another rebound from 1.3435. The bullish trend is still intact, but a close below 1.3435 would suggest a drop toward the 76.4% level at 1.3118. A bearish divergence has formed on the CCI indicator, which led to a pullback to 1.3435. I still don't expect a significant decline in the pair for now.

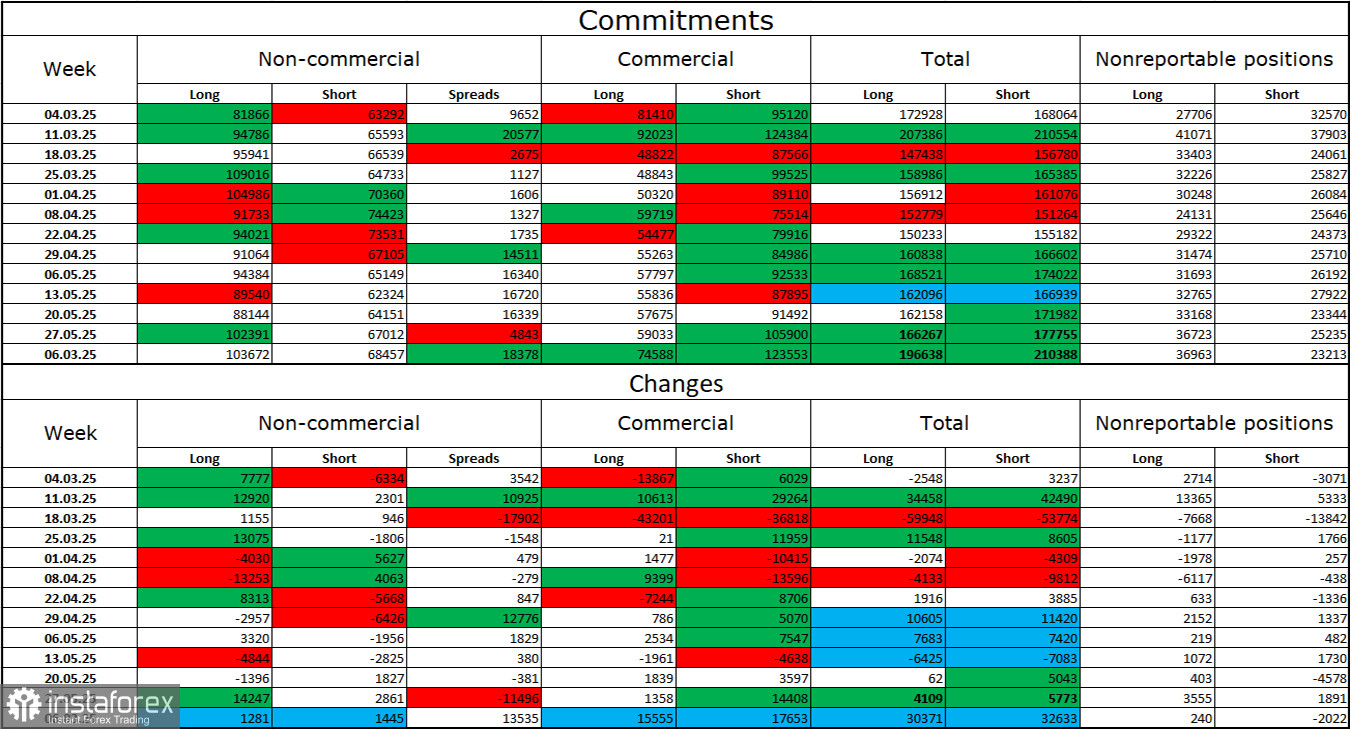
Commitments of Traders (COT) Report

This image is no longer relevant

The sentiment of the "Non-commercial" trader category did not change significantly last week. The number of long positions among speculators increased by 1,281, while short positions increased by 1,445. Bears have long lost the upper hand in the market. The gap between long and short positions stands at 35,000 in favor of the bulls: 103,000 vs. 68,000.

In my view, the pound still has room for decline, but recent developments have shifted the market's long-term sentiment. Over the past three months, long positions have grown from 65,000 to 103,000, while short positions have decreased from 76,000 to 68,000. Under Donald Trump, faith in the U.S. dollar has weakened, and COT reports show that traders have little desire to buy the dollar. Regardless of the overall news environment, the dollar continues to fall amid Trump-related developments.

Economic Calendar for the U.S. and UK:

  • UK – Unemployment Rate (06:00 UTC)
  • UK – Change in Claimant Count (06:00 UTC)
  • UK – Change in Average Hourly Earnings (06:00 UTC)

On Tuesday, the economic calendar includes these three UK reports, which have already been released and triggered a strong bearish response. For the remainder of the day, the news background is not expected to influence trader sentiment significantly.

GBP/USD Outlook and Trading Advice

Selling the pair was possible after the rebound from the resistance zone of 1.3611–1.3620 on the hourly chart, with a target of 1.3520 — which has already been reached. New short positions were possible upon closing below 1.3520, with targets at 1.3425 and 1.3357.Buying opportunities will arise if there is a rebound from 1.3425 or the 1.3357–1.3344 zone.

Fibonacci Level Grids:

  • On the hourly chart: from 1.3205 to 1.2695
  • On the 4-hour chart: from 1.3431 to 1.2104
Samir Klishi,
Analytical expert of InstaForex
© 2007-2025
Select timeframe
5
min
15
min
30
min
1
hour
4
hours
1
day
1
week
Earn on cryptocurrency rate changes with InstaForex
Download MetaTrader 4 and open your first trade
  • Grand Choice
    Contest by
    InstaForex
    InstaForex always strives to help you
    fulfill your biggest dreams.
    JOIN CONTEST

Recommended Stories

USD/JPY. Analysis and Forecast. Current Market Situation

From a technical perspective, as bulls have overcome the barrier of the 100-day Simple Moving Average (SMA) around the 146.80 level, they remain in control. Buying beyond the psychological level

Irina Yanina 17:53 2025-06-23 UTC+2

Trading Signals for EUR/USD for June 23-28, 2025: buy above 1.1460 (21 SMA - 6/8 Murray)

On the contrary, this area around the 21SMA, located at the psychological level of 1.15, is key. Below this area, we could expect a sharp breakout of the uptrend channel

Dimitrios Zappas 16:34 2025-06-23 UTC+2

Trading Signals for GOLD (XAU/USD) for June 23-28, 2025: buy above $3,350 (21 SMA - 7/8 Murray)

If gold continues its recovery and settles above the 21 SMA at 3,364, this could be seen as a buying opportunity with targets at 8/8 Murray at 3,437. The metal

Dimitrios Zappas 16:23 2025-06-23 UTC+2

Forex forecast 23/06/2025: EUR/USD, GBP/USD, USDX, Oil, Ethereum and Bitcoin

Useful links: My other articles are available in this section InstaForex course for beginners Popular Analytics Open trading account Important: The begginers in forex trading need to be very careful

Sebastian Seliga 12:08 2025-06-23 UTC+2

Technical Analysis for the Week of June 23–28: GBP/USD Currency Pair

Last week, the pair moved downward and tested the 14.6% pullback level at 1.3392 (red dashed line), after which the price rebounded and closed the weekly candle at 1.3446

Stefan Doll 11:38 2025-06-23 UTC+2

Technical Analysis for the Week of June 23–28: EUR/USD Currency Pair

Last week, the pair moved downward and tested the 76.4% pullback level at 1.1452 (red dashed line), after which the price rebounded and closed the weekly candle at 1.1520

Stefan Doll 11:31 2025-06-23 UTC+2

Forecast for EUR/USD on June 23, 2025

On Friday, the EUR/USD pair continued to rise after rebounding from the 76.4% corrective level at 1.1454. However, on Monday night, the pair returned to this level. A new rebound

Samir Klishi 11:24 2025-06-23 UTC+2

Forecast for GBP/USD on June 23, 2025

On the hourly chart, the GBP/USD pair on Friday consolidated below the support zone of 1.3425–1.3444, once again allowing for the expectation of a continued decline toward the support level

Samir Klishi 11:19 2025-06-23 UTC+2

Technical Analysis of Daily Price Movement of USD/IDR Exotic Currency Pairs, Monday June 23, 2025.

16473.27 Currently on the Daily chart, the Exotic USD/IDR currency pair has a Bullish 123 pattern which indicates that USD/IDR is currently strengthening, where this is also confirmed

Arief Makmur 07:29 2025-06-23 UTC+2

Technical Analysis of Intraday Price Movement of Crude Oil Commodity Instrument, Monday June 23, 2025.

In addition to the appearance of Divergence between the price movement of Crude Oil and the Stochastic Oscillator indicator on the 4-hour chart, there is also a Bearish 123 pattern

Arief Makmur 07:29 2025-06-23 UTC+2
Can't speak right now?
Ask your question in the chat.
Widget callback
 

Dear visitor,

Your IP address shows that you are currently located in the USA. If you are a resident of the United States, you are prohibited from using the services of InstaFintech Group including online trading, online transfers, deposit/withdrawal of funds, etc.

If you think you are seeing this message by mistake and your location is not the US, kindly proceed to the website. Otherwise, you must leave the website in order to comply with government restrictions.

Why does your IP address show your location as the USA?

  • - you are using a VPN provided by a hosting company based in the United States;
  • - your IP does not have proper WHOIS records;
  • - an error occurred in the WHOIS geolocation database.

Please confirm whether you are a US resident or not by clicking the relevant button below. If you choose the wrong option, being a US resident, you will not be able to open an account with InstaForex anyway.

We are sorry for any inconvenience caused by this message.