EUR/USD 5-Minute Analysis
On Thursday, the EUR/USD currency pair displayed a complete lack of activity, showing no inclination to trade or move. Despite the Federal Reserve meeting held the previous day, the market's reaction was extremely weak. This is not particularly surprising, as the key parameters of monetary policy remained unchanged. Only the expectations for a rate cut by 2027 were slightly tightened. Now, Fed officials foresee a total of four rate cuts over the next two and a half years, compared to the previous dot plot that projected six.
Thus, formally, the Fed meeting can be called hawkish, and the dollar had a chance to strengthen a bit more. However, on Thursday, the market seemed to remember that it was dealing with the U.S. dollar, the "president" of which is Donald Trump. And Trump has no intention of backing down from his protectionist actions and aggressive rhetoric against half the world. It appears the Republican is not just trying to fix the U.S. trade balance but also to reshape the entire world to his liking.
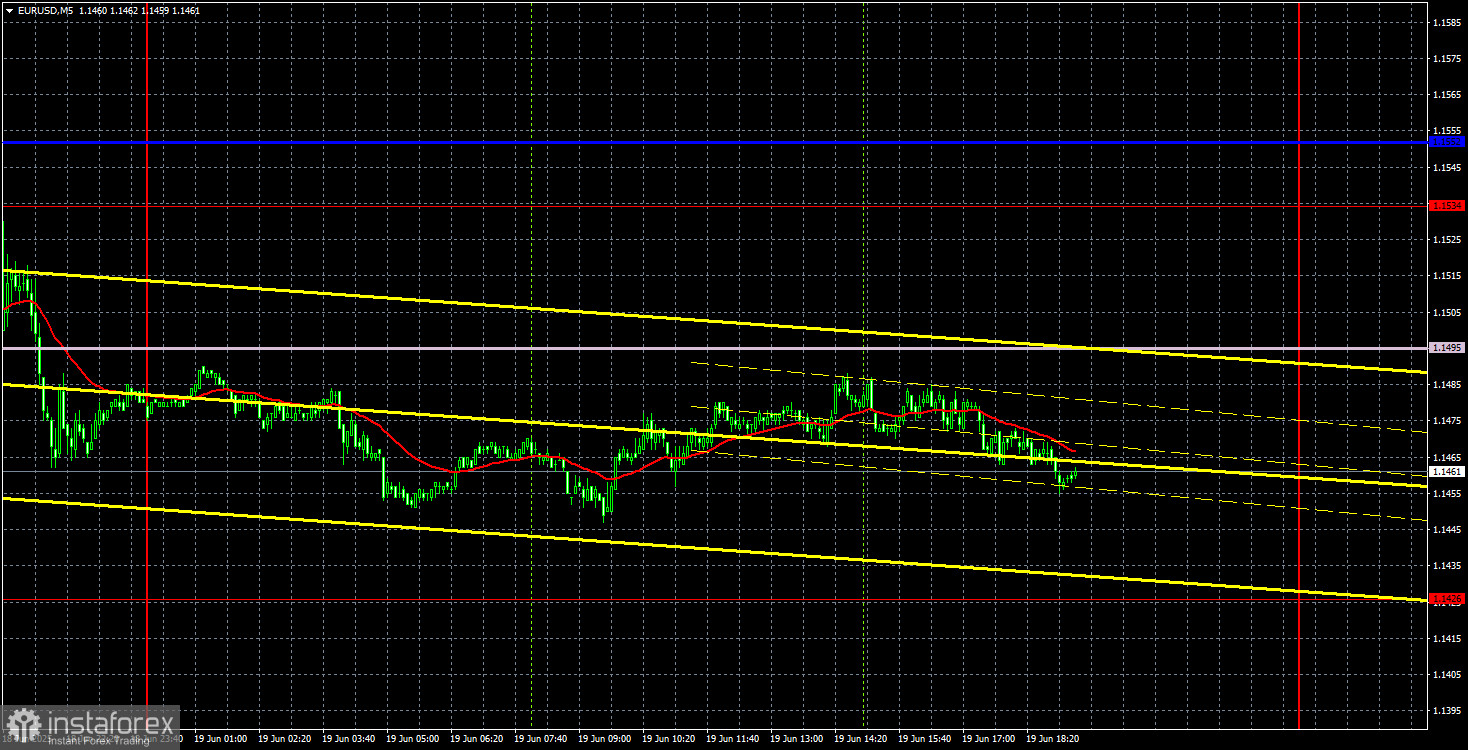
There was practically no macroeconomic background on Thursday. Christine Lagarde gave two speeches in the EU but did not say a word about monetary policy. From a technical standpoint, a downtrend has formed. The price is below the Ichimoku indicator lines, and a descending trendline has also formed. Therefore, the dollar may still expect some strengthening.
In the 5-minute time frame, no trading signals were formed yesterday, and intraday volatility was extremely low.
EUR/USD 1D Chart Analysis – ICT
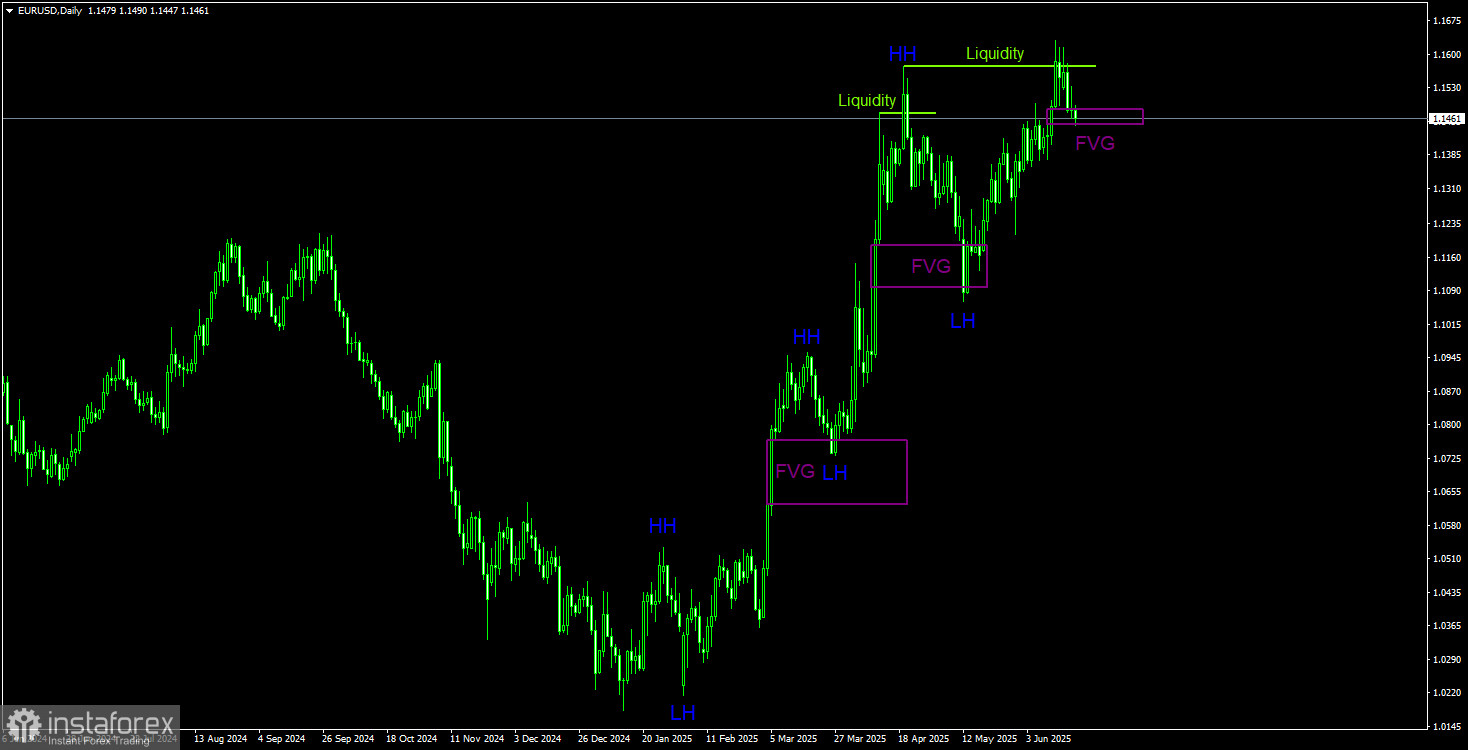
In the long term, we see a clear uptrend. Of course, this uptrend will end someday, but the only current signal for a potential drop is the liquidity grab from the last higher high (HH). On the bullish side, we have a bullish Fair Value Gap (FVG) zone. A bounce from this zone, confirmed on lower timeframes, would indicate the resumption of the euro's growth. The uptrend remains valid as long as the price stays above the 1.1100 level. This means the dollar could even strengthen by a few hundred points without changing the broader trend. Fundamentally, the backdrop continues to work against the U.S. dollar.
COT Report
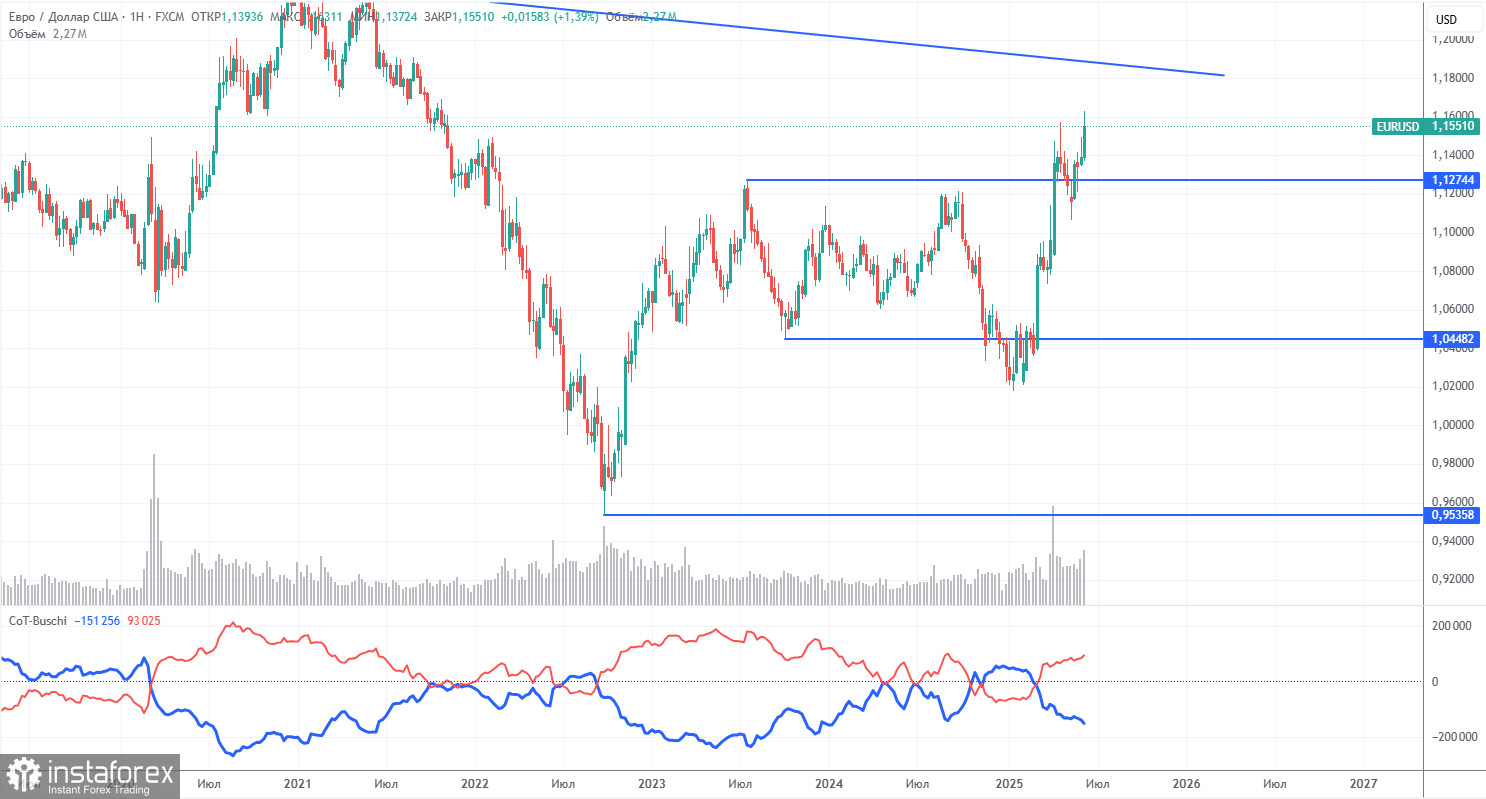
The latest COT report is dated June 10. As shown in the chart above, the net position of non-commercial traders has been bullish for a long time. Bears gained the upper hand briefly at the end of 2024 but quickly lost it. Since Trump assumed the U.S. presidency, the dollar has done nothing but decline.
We can't say with 100% certainty that the dollar will continue to fall, but current global developments suggest that it will.
We still don't see any fundamental drivers supporting the euro, but one strong reason remains for continued dollar weakness. The global downtrend is still in place, but who cares about the 16-year price history now? If Trump ends his trade wars, the dollar may start to rise again — but will he ever end them? And when?
The red and blue lines have crossed again, meaning the market trend has become bullish again. During the latest reporting week, long positions in the "Non-commercial" group rose by 6,000, while short positions declined by 4,300. Therefore, the net position increased by 10,300 over the week.
EUR/USD 1-Hour Analysis
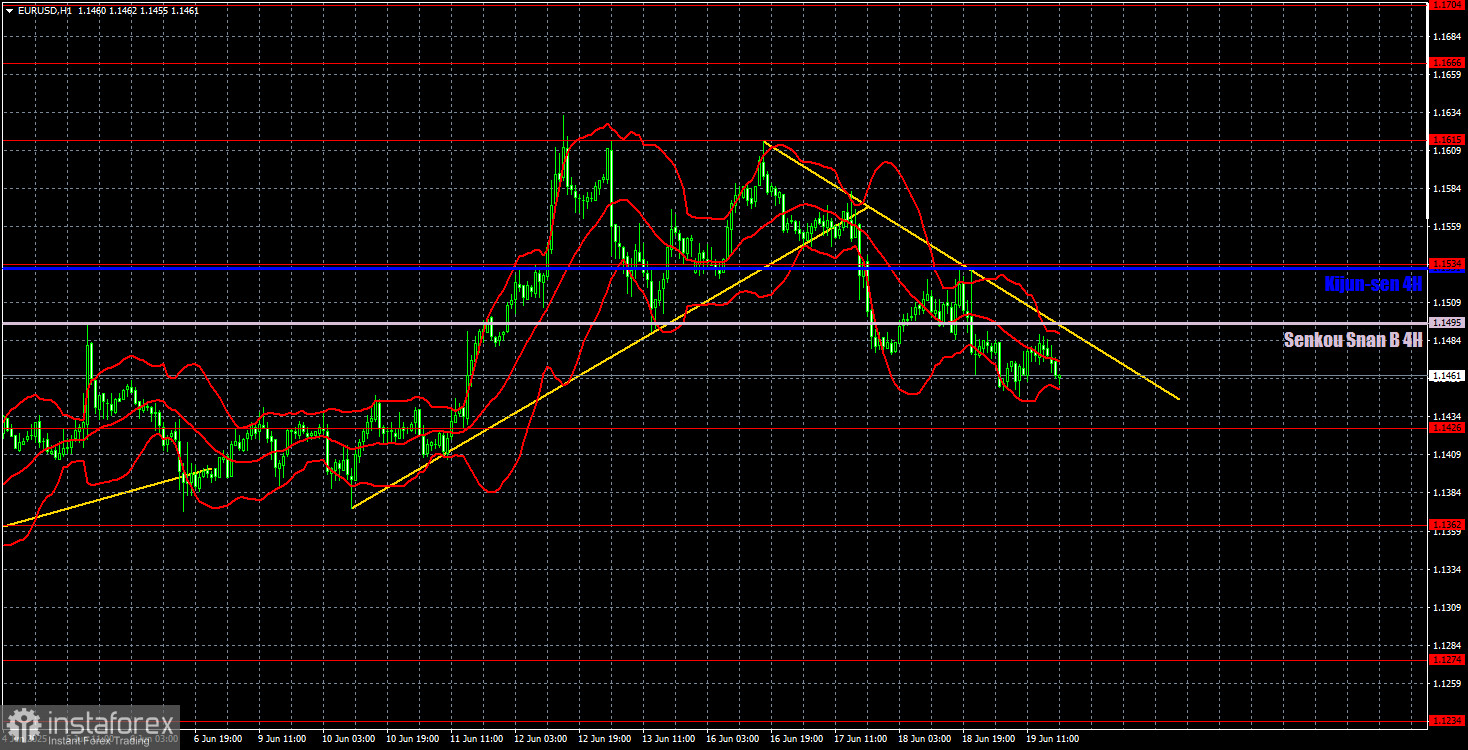
In the hourly time frame, the EUR/USD pair has started to form a local downward trend, which may end as early as today. The pair entered the Fair Value Gap area in the daily time frame, making a bounce and a resumption of growth quite likely. In the coming days, the U.S. may also strike Iran, which could trigger a decline in the U.S. dollar. Meanwhile, Trump's policies remain unchanged. The fact that the dollar is not falling right now is just a coincidence or a temporary pause.
For June 20, we highlight the following levels for trading: 1.1092, 1.1147, 1.1185, 1.1234, 1.1274, 1.1362, 1.1426, 1.1534, 1.1615, 1.1666, 1.1704, 1.1750, as well as the Senkou Span B line (1.1495) and the Kijun-sen line (1.1534). The Ichimoku indicator lines may shift during the day, which should be considered when identifying trading signals. Don't forget to move your Stop Loss to breakeven if the price moves 15 pips in the correct direction. This will protect you from potential losses if the signal is false.
On Friday, no significant events or reports are scheduled in the Eurozone or the U.S. Therefore, we may be in for a rather dull trading day with low volatility. The only hope lies with Trump.
Illustration Explanations:
- Support and resistance price levels – thick red lines where movement may end. They are not trading signal sources.
- Kijun-sen and Senkou Span B lines—These are strong Ichimoku indicator lines transferred to the hourly timeframe from the 4-hour one.
- Extremum levels – thin red lines where the price has previously rebounded. These act as trading signal sources.
- Yellow lines – trend lines, trend channels, and other technical patterns.
- COT Indicator 1 on the charts – the size of the net position for each category of traders.