signal strength 3 of 5

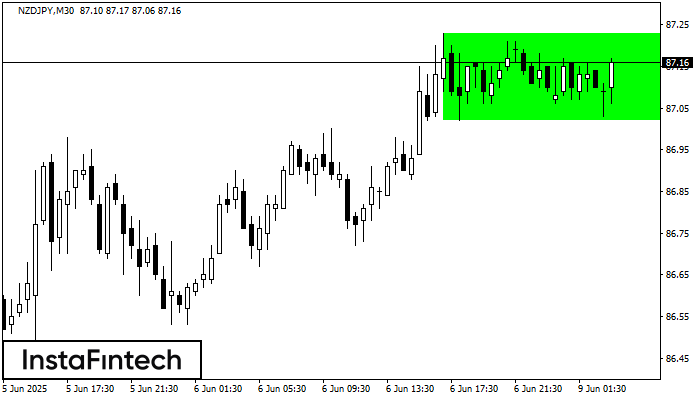
According to the chart of M30, NZDJPY formed the Bullish Rectangle which is a pattern of a trend continuation. The pattern is contained within the following borders: the lower border 87.02 – 87.02 and upper border 87.23 – 87.23. In case the upper border is broken, the instrument is likely to follow the upward trend.
- All
- Double Top
- Flag
- Head and Shoulders
- Pennant
- Rectangle
- Triangle
- Triple top
- All
- #AAPL
- #AMZN
- #Bitcoin
- #EBAY
- #FB
- #GOOG
- #INTC
- #KO
- #MA
- #MCD
- #MSFT
- #NTDOY
- #PEP
- #TSLA
- #TWTR
- AUDCAD
- AUDCHF
- AUDJPY
- AUDUSD
- EURCAD
- EURCHF
- EURGBP
- EURJPY
- EURNZD
- EURRUB
- EURUSD
- GBPAUD
- GBPCHF
- GBPJPY
- GBPUSD
- GOLD
- NZDCAD
- NZDCHF
- NZDJPY
- NZDUSD
- SILVER
- USDCAD
- USDCHF
- USDJPY
- USDRUB
- All
- M5
- M15
- M30
- H1
- D1
- All
- Buy
- Sale
- All
- 1
- 2
- 3
- 4
- 5
The Double Top reversal pattern has been formed on #TSLA M15. Characteristics: the upper boundary 330.45; the lower boundary 324.60; the width of the pattern is 603 points. Sell trades
The M5 and M15 time frames may have more false entry points.
Open chart in a new windowThe Double Top pattern has been formed on #TSLA M5. It signals that the trend has been changed from upwards to downwards. Probably, if the base of the pattern 328.99
The M5 and M15 time frames may have more false entry points.
Open chart in a new windowThe Bullish pennant signal – Trading instrument #TSLA M15, continuation pattern. Forecast: it is possible to set up a buy position above the pattern’s high of 330.45, with the prospect
The M5 and M15 time frames may have more false entry points.
Open chart in a new window