signal strength 3 of 5

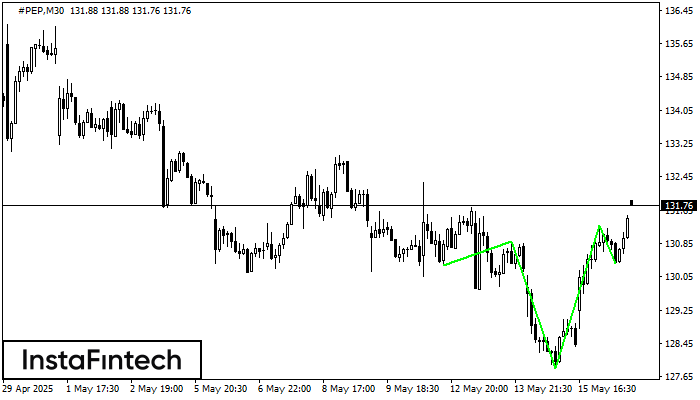
According to the chart of M30, #PEP produced the pattern termed the Inverse Head and Shoulder. The Head is fixed at 127.86 while the median line of the Neck is set at 130.89/131.28. The formation of the Inverse Head and Shoulder Pattern clearly indicates a reversal of the downward trend. In means that in case the scenario comes true, the price of #PEP will go towards 131.58.
See Also
- All
- Double Top
- Flag
- Head and Shoulders
- Pennant
- Rectangle
- Triangle
- Triple top
- All
- #AAPL
- #AMZN
- #Bitcoin
- #EBAY
- #FB
- #GOOG
- #INTC
- #KO
- #MA
- #MCD
- #MSFT
- #NTDOY
- #PEP
- #TSLA
- #TWTR
- AUDCAD
- AUDCHF
- AUDJPY
- AUDUSD
- EURCAD
- EURCHF
- EURGBP
- EURJPY
- EURNZD
- EURRUB
- EURUSD
- GBPAUD
- GBPCHF
- GBPJPY
- GBPUSD
- GOLD
- NZDCAD
- NZDCHF
- NZDJPY
- NZDUSD
- SILVER
- USDCAD
- USDCHF
- USDJPY
- USDRUB
- All
- M5
- M15
- M30
- H1
- D1
- All
- Buy
- Sale
- All
- 1
- 2
- 3
- 4
- 5
The Triple Top pattern has formed on the chart of the #GOOG M5 trading instrument. It is a reversal pattern featuring the following characteristics: resistance level -16, support level -46
The M5 and M15 time frames may have more false entry points.
Open chart in a new windowThe Double Bottom pattern has been formed on #Bitcoin M5. Characteristics: the support level 104078.49; the resistance level 104563.94; the width of the pattern 48545 points. If the resistance level
The M5 and M15 time frames may have more false entry points.
Open chart in a new windowThe technical pattern called Head and Shoulders has appeared on the chart of USDCHF M5. There are weighty reasons to suggest that the price will surpass the Neckline 0.8138/0.8137 after
The M5 and M15 time frames may have more false entry points.
Open chart in a new window