was formed on 22.05 at 02:30:50 (UTC+0)
signal strength 3 of 5

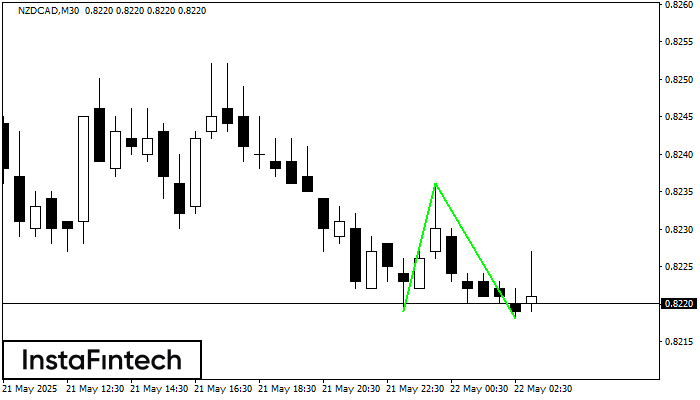
The Double Bottom pattern has been formed on NZDCAD M30. Characteristics: the support level 0.8219; the resistance level 0.8236; the width of the pattern 17 points. If the resistance level is broken, a change in the trend can be predicted with the first target point lying at the distance of 18 points.
See Also
- All
- Double Top
- Flag
- Head and Shoulders
- Pennant
- Rectangle
- Triangle
- Triple top
- All
- #AAPL
- #AMZN
- #EBAY
- #FB
- #GOOG
- #INTC
- #KO
- #MA
- #MCD
- #MSFT
- #NTDOY
- #PEP
- #TSLA
- #TWTR
- AUDCAD
- AUDCHF
- AUDJPY
- AUDUSD
- EURCAD
- EURCHF
- EURGBP
- EURJPY
- EURNZD
- EURRUB
- EURUSD
- GBPAUD
- GBPCHF
- GBPJPY
- GBPUSD
- GOLD
- NZDCAD
- NZDCHF
- NZDJPY
- NZDUSD
- SILVER
- USDCAD
- USDCHF
- USDJPY
- USDRUB
- All
- M5
- M15
- M30
- H1
- D1
- All
- Buy
- Sale
- All
- 1
- 2
- 3
- 4
- 5
The Double Bottom pattern has been formed on GBPJPY M5; the upper boundary is 195.10; the lower boundary is 194.74. The width of the pattern is 35 points. In case
The M5 and M15 time frames may have more false entry points.
Open chart in a new windowAccording to the chart of M5, #MCD produced the pattern termed the Inverse Head and Shoulder. The Head is fixed at 307.79 while the median line of the Neck
The M5 and M15 time frames may have more false entry points.
Open chart in a new windowAccording to the chart of M5, #NTDOY formed the Bearish Symmetrical Triangle pattern. Description: The lower border is 20.47/20.60 and upper border is 20.74/20.60. The pattern width is measured
The M5 and M15 time frames may have more false entry points.
Open chart in a new window