signal strength 1 of 5

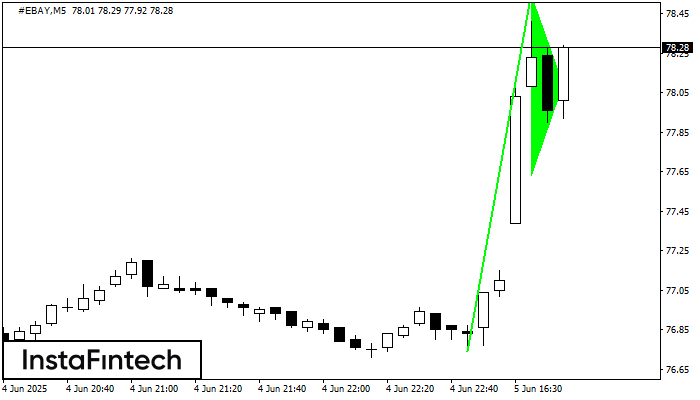
The Bullish pennant pattern is formed on the #EBAY M5 chart. It is a type of the continuation pattern. Supposedly, in case the price is fixed above the pennant’s high of 78.55, a further uptrend is possible.
The M5 and M15 time frames may have more false entry points.
See Also
- All
- Double Top
- Flag
- Head and Shoulders
- Pennant
- Rectangle
- Triangle
- Triple top
- All
- #AAPL
- #AMZN
- #Bitcoin
- #EBAY
- #FB
- #GOOG
- #INTC
- #KO
- #MA
- #MCD
- #MSFT
- #NTDOY
- #PEP
- #TSLA
- #TWTR
- AUDCAD
- AUDCHF
- AUDJPY
- AUDUSD
- EURCAD
- EURCHF
- EURGBP
- EURJPY
- EURNZD
- EURRUB
- EURUSD
- GBPAUD
- GBPCHF
- GBPJPY
- GBPUSD
- GOLD
- NZDCAD
- NZDCHF
- NZDJPY
- NZDUSD
- SILVER
- USDCAD
- USDCHF
- USDJPY
- USDRUB
- All
- M5
- M15
- M30
- H1
- D1
- All
- Buy
- Sale
- All
- 1
- 2
- 3
- 4
- 5
The Double Bottom pattern has been formed on #MCD M5; the upper boundary is 293.45; the lower boundary is 292.41. The width of the pattern is 102 points. In case
The M5 and M15 time frames may have more false entry points.
Open chart in a new windowThe Triple Top pattern has formed on the chart of the USDJPY M5 trading instrument. It is a reversal pattern featuring the following characteristics: resistance level -1, support level -22
The M5 and M15 time frames may have more false entry points.
Open chart in a new windowAccording to the chart of M5, GBPAUD produced the pattern termed the Inverse Head and Shoulder. The Head is fixed at 2.0712 while the median line of the Neck
The M5 and M15 time frames may have more false entry points.
Open chart in a new window