signal strength 3 of 5

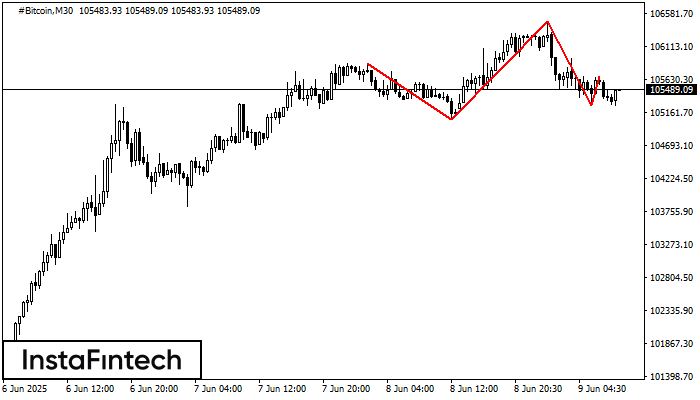
According to the chart of M30, #Bitcoin formed the Head and Shoulders pattern. The Head’s top is set at 106466.59 while the median line of the Neck is found at 105061.92/105266.00. The formation of the Head and Shoulders pattern evidently signals a reversal of the upward trend. In other words, in case the scenario comes true, the price of #Bitcoin will go towards 105265.70.
- All
- Double Top
- Flag
- Head and Shoulders
- Pennant
- Rectangle
- Triangle
- Triple top
- All
- #AAPL
- #AMZN
- #Bitcoin
- #EBAY
- #FB
- #GOOG
- #INTC
- #KO
- #MA
- #MCD
- #MSFT
- #NTDOY
- #PEP
- #TSLA
- #TWTR
- AUDCAD
- AUDCHF
- AUDJPY
- AUDUSD
- EURCAD
- EURCHF
- EURGBP
- EURJPY
- EURNZD
- EURRUB
- EURUSD
- GBPAUD
- GBPCHF
- GBPJPY
- GBPUSD
- GOLD
- NZDCAD
- NZDCHF
- NZDJPY
- NZDUSD
- SILVER
- USDCAD
- USDCHF
- USDJPY
- USDRUB
- All
- M5
- M15
- M30
- H1
- D1
- All
- Buy
- Sale
- All
- 1
- 2
- 3
- 4
- 5
According to the chart of M5, GBPCHF formed the Bullish Rectangle. This type of a pattern indicates a trend continuation. It consists of two levels: resistance 1.0973 and support 1.0964
The M5 and M15 time frames may have more false entry points.
Open chart in a new windowThe Triple Top pattern has formed on the chart of the USDCHF M15 trading instrument. It is a reversal pattern featuring the following characteristics: resistance level 1, support level -16
The M5 and M15 time frames may have more false entry points.
Open chart in a new windowThe Double Top pattern has been formed on GBPCHF M5. It signals that the trend has been changed from upwards to downwards. Probably, if the base of the pattern 1.0965
The M5 and M15 time frames may have more false entry points.
Open chart in a new window