signal strength 3 of 5

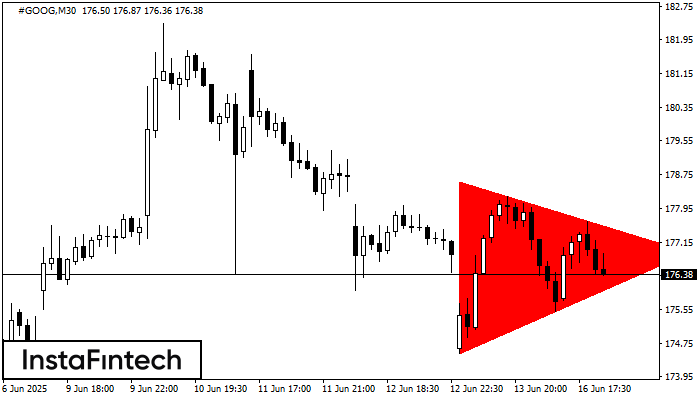
According to the chart of M30, #GOOG formed the Bearish Symmetrical Triangle pattern. Description: The lower border is 174.50/176.90 and upper border is 178.59/176.90. The pattern width is measured on the chart at -409 pips. The formation of the Bearish Symmetrical Triangle pattern evidently signals a continuation of the downward trend. In other words, if the scenario comes true and #GOOG breaches the lower border, the price could continue its move toward 176.60.
- All
- Double Top
- Flag
- Head and Shoulders
- Pennant
- Rectangle
- Triangle
- Triple top
- All
- #AAPL
- #AMZN
- #Bitcoin
- #EBAY
- #FB
- #GOOG
- #INTC
- #KO
- #MA
- #MCD
- #MSFT
- #NTDOY
- #PEP
- #TSLA
- #TWTR
- AUDCAD
- AUDCHF
- AUDJPY
- AUDUSD
- EURCAD
- EURCHF
- EURGBP
- EURJPY
- EURNZD
- EURRUB
- EURUSD
- GBPAUD
- GBPCHF
- GBPJPY
- GBPUSD
- GOLD
- NZDCAD
- NZDCHF
- NZDJPY
- NZDUSD
- SILVER
- USDCAD
- USDCHF
- USDJPY
- USDRUB
- All
- M5
- M15
- M30
- H1
- D1
- All
- Buy
- Sale
- All
- 1
- 2
- 3
- 4
- 5
The Double Top pattern has been formed on GBPJPY M5. It signals that the trend has been changed from upwards to downwards. Probably, if the base of the pattern 198.91
The M5 and M15 time frames may have more false entry points.
Open chart in a new windowThe Triple Bottom pattern has been formed on NZDCAD M5. It has the following characteristics: resistance level 0.8207/0.8205; support level 0.8197/0.8197; the width is 10 points. In the event
The M5 and M15 time frames may have more false entry points.
Open chart in a new windowThe Triple Bottom pattern has been formed on NZDUSD M5. It has the following characteristics: resistance level 0.5977/0.5975; support level 0.5963/0.5966; the width is 14 points. In the event
The M5 and M15 time frames may have more false entry points.
Open chart in a new window