signal strength 1 of 5

The Double Bottom pattern has been formed on #Bitcoin M5. Characteristics: the support level 103472.45; the resistance level 103745.49; the width of the pattern 27304 points. If the resistance level is broken, a change in the trend can be predicted with the first target point lying at the distance of 29388 points.
The M5 and M15 time frames may have more false entry points.
See Also
- All
- Double Top
- Flag
- Head and Shoulders
- Pennant
- Rectangle
- Triangle
- Triple top
- All
- #AAPL
- #AMZN
- #Bitcoin
- #EBAY
- #FB
- #GOOG
- #INTC
- #KO
- #MA
- #MCD
- #MSFT
- #NTDOY
- #PEP
- #TSLA
- #TWTR
- AUDCAD
- AUDCHF
- AUDJPY
- AUDUSD
- EURCAD
- EURCHF
- EURGBP
- EURJPY
- EURNZD
- EURRUB
- EURUSD
- GBPAUD
- GBPCHF
- GBPJPY
- GBPUSD
- GOLD
- NZDCAD
- NZDCHF
- NZDJPY
- NZDUSD
- SILVER
- USDCAD
- USDCHF
- USDJPY
- USDRUB
- All
- M5
- M15
- M30
- H1
- D1
- All
- Buy
- Sale
- All
- 1
- 2
- 3
- 4
- 5
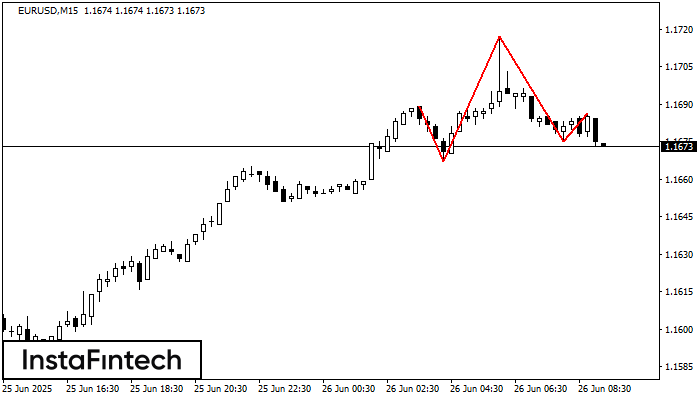
The technical pattern called Head and Shoulders has appeared on the chart of EURUSD M15. There are weighty reasons to suggest that the price will surpass the Neckline 1.1667/1.1675 after
The M5 and M15 time frames may have more false entry points.
Open chart in a new window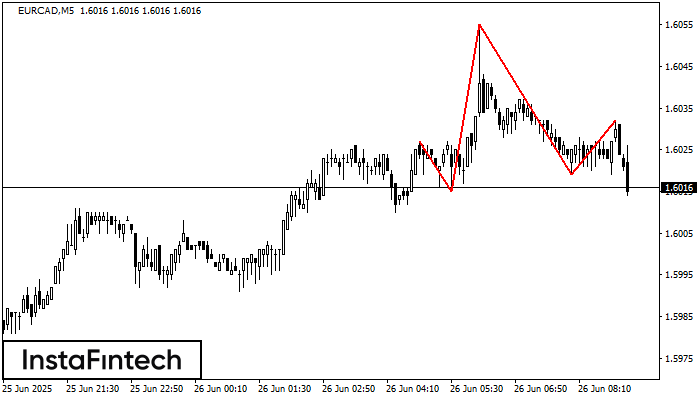
The EURCAD M5 formed the Head and Shoulders pattern with the following features: The Head’s top is at 1.6055, the Neckline and the upward angle are at 1.6015/1.6019. The formation
The M5 and M15 time frames may have more false entry points.
Open chart in a new window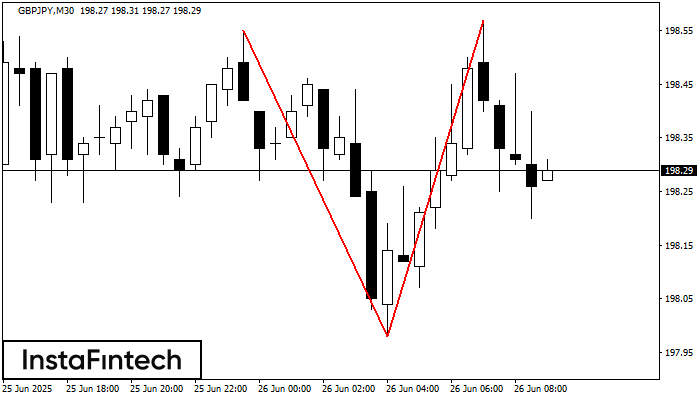
On the chart of GBPJPY M30 the Double Top reversal pattern has been formed. Characteristics: the upper boundary 198.57; the lower boundary 197.98; the width of the pattern 59 points
Open chart in a new window