Actual patterns
Patterns are graphical models which are formed in the chart by the price. According to one of the technical analysis postulates, history (price movement) repeats itself. It means that the price movements are often similar in the same situations which makes it possible to predict the further development of the situation with a high probability.
Actual Patterns
- All
- Double Top
- Flag
- Head and Shoulders
- Pennant
- Rectangle
- Triangle
- Triple top
- All
- #AAPL
- #AMZN
- #Bitcoin
- #EBAY
- #FB
- #GOOG
- #INTC
- #KO
- #MA
- #MCD
- #MSFT
- #NTDOY
- #PEP
- #TSLA
- #TWTR
- AUDCAD
- AUDCHF
- AUDJPY
- AUDUSD
- EURCAD
- EURCHF
- EURGBP
- EURJPY
- EURNZD
- EURRUB
- EURUSD
- GBPAUD
- GBPCHF
- GBPJPY
- GBPUSD
- GOLD
- NZDCAD
- NZDCHF
- NZDJPY
- NZDUSD
- SILVER
- USDCAD
- USDCHF
- USDJPY
- USDRUB
- All
- M5
- M15
- M30
- H1
- D1
- All
- Buy
- Sale
- All
- 1
- 2
- 3
- 4
- 5
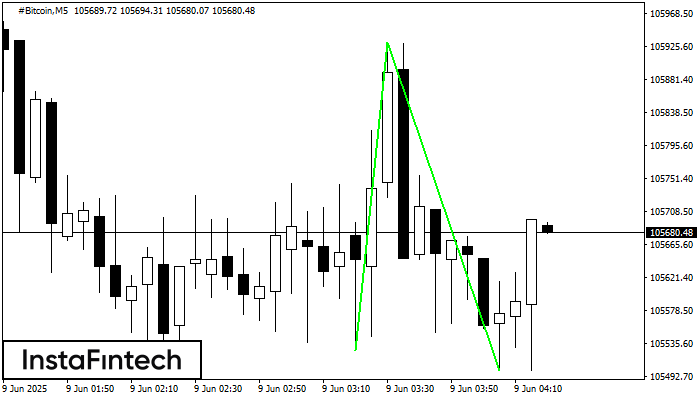
The Double Bottom pattern has been formed on #Bitcoin M5. This formation signals a reversal of the trend from downwards to upwards. The signal is that a buy trade should
The M5 and M15 time frames may have more false entry points.
Open chart in a new window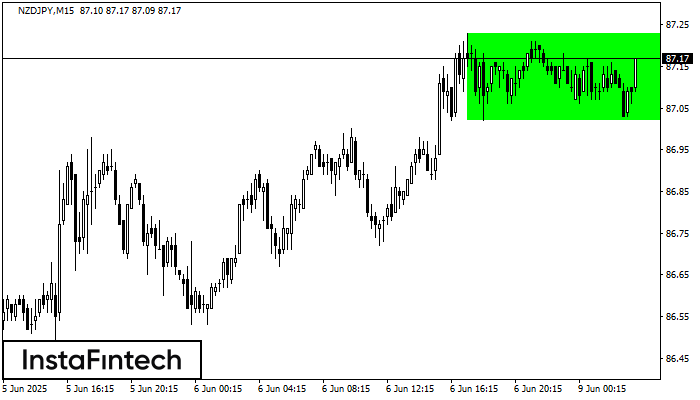
According to the chart of M15, NZDJPY formed the Bullish Rectangle. The pattern indicates a trend continuation. The upper border is 87.23, the lower border is 87.02. The signal means
The M5 and M15 time frames may have more false entry points.
Open chart in a new window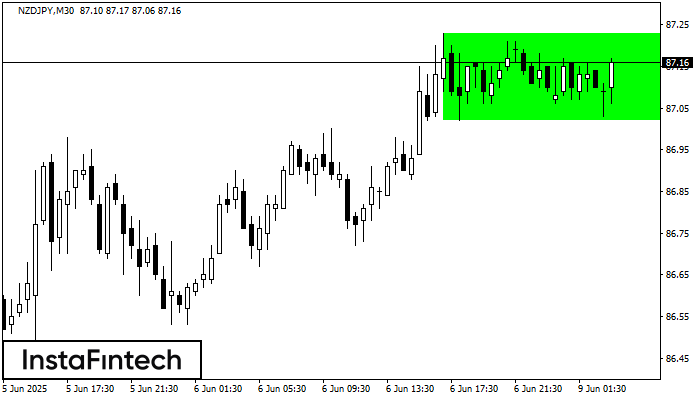
According to the chart of M30, NZDJPY formed the Bullish Rectangle which is a pattern of a trend continuation. The pattern is contained within the following borders: the lower border
Open chart in a new window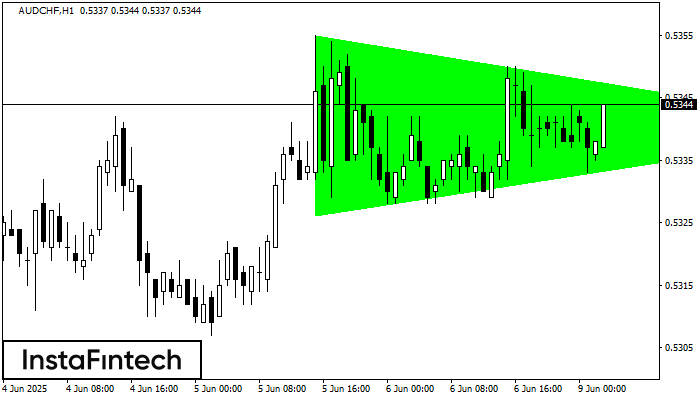
According to the chart of H1, AUDCHF formed the Bullish Symmetrical Triangle pattern, which signals the trend will continue. Description. The upper border of the pattern touches the coordinates 0.5355/0.5340
Open chart in a new window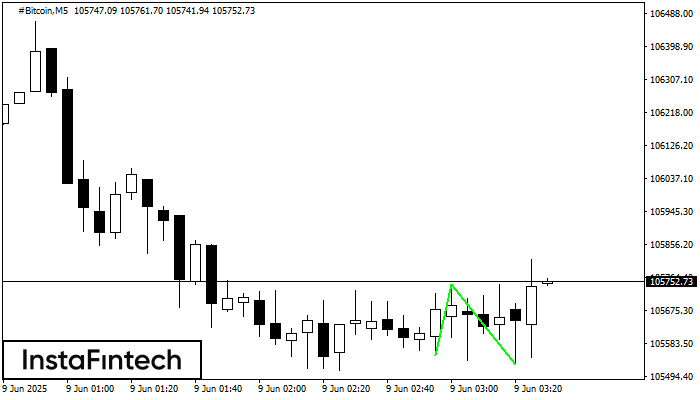
The Double Bottom pattern has been formed on #Bitcoin M5. Characteristics: the support level 105551.21; the resistance level 105745.22; the width of the pattern 19401 points. If the resistance level
The M5 and M15 time frames may have more false entry points.
Open chart in a new window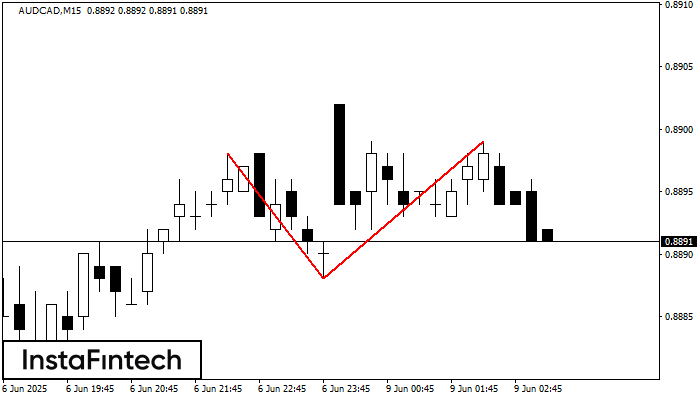
On the chart of AUDCAD M15 the Double Top reversal pattern has been formed. Characteristics: the upper boundary 0.8899; the lower boundary 0.8888; the width of the pattern 11 points
The M5 and M15 time frames may have more false entry points.
Open chart in a new window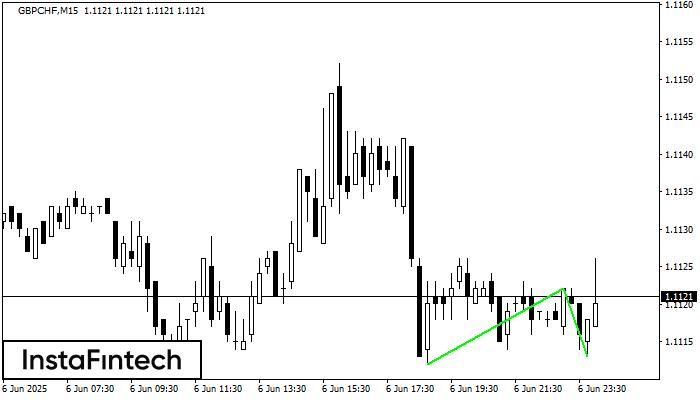
The Double Bottom pattern has been formed on GBPCHF M15. Characteristics: the support level 1.1112; the resistance level 1.1122; the width of the pattern 10 points. If the resistance level
The M5 and M15 time frames may have more false entry points.
Open chart in a new window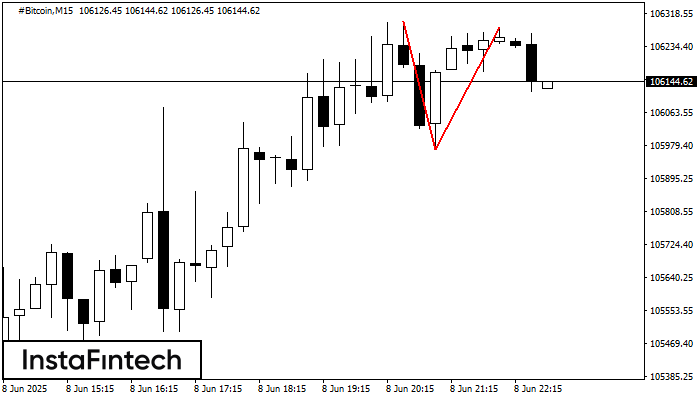
The Double Top reversal pattern has been formed on #Bitcoin M15. Characteristics: the upper boundary 106299.16; the lower boundary 105969.75; the width of the pattern is 31259 points. Sell trades
The M5 and M15 time frames may have more false entry points.
Open chart in a new window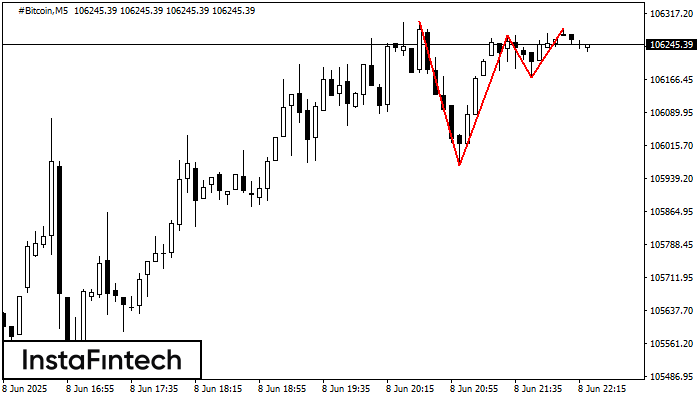
The Triple Top pattern has formed on the chart of the #Bitcoin M5. Features of the pattern: borders have an ascending angle; the lower line of the pattern
The M5 and M15 time frames may have more false entry points.
Open chart in a new window