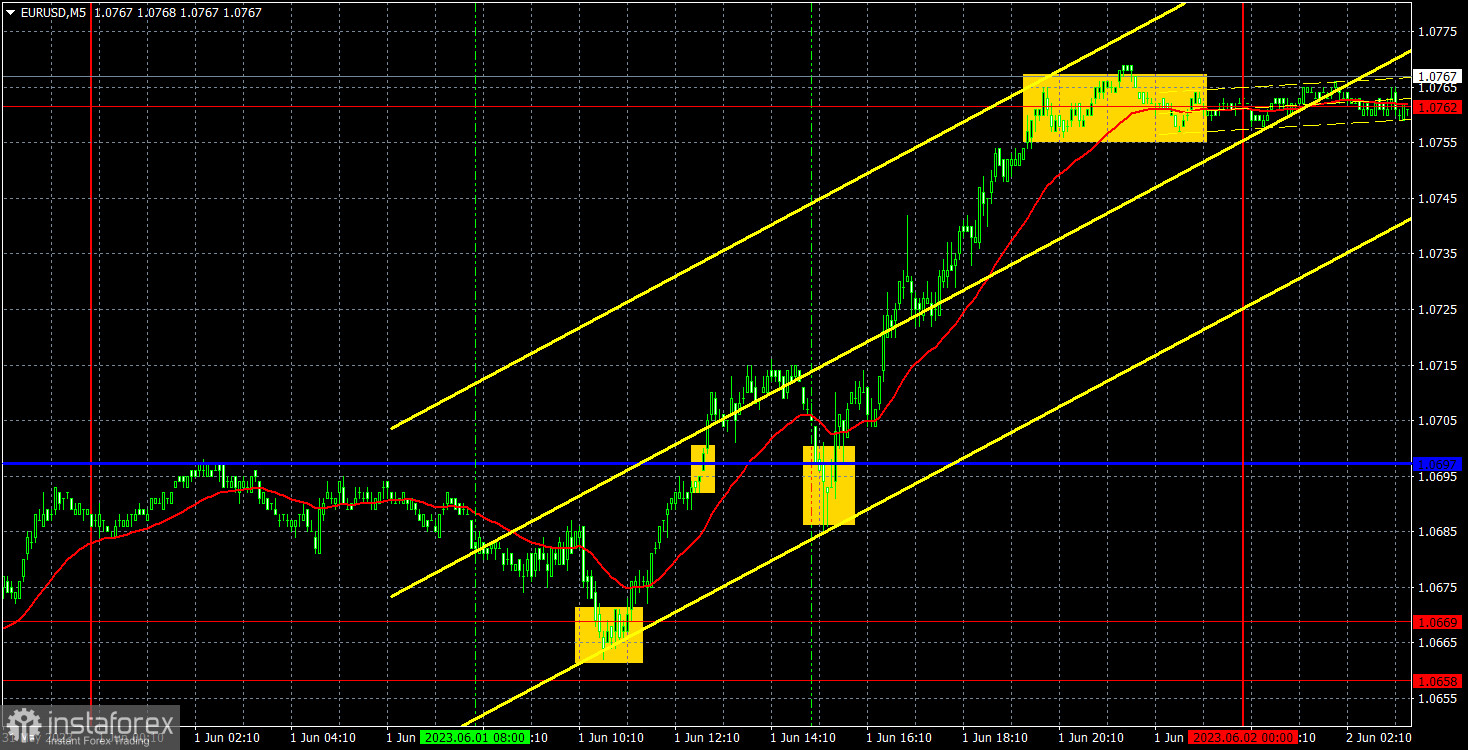
empty
02.06.2023 07:57 AM
EUR/USD: Forecast and trading signals on June 2, 2023. COT report. Detailed analysis of price movement and trades. The euro's unexpected growth

5M chart of EUR/USD

This image is no longer relevant

The EUR/USD pair sharply grew on Thursday. It wasn't exactly predictable, but it was not illogical either. The first factor to consider is that the pair had been declining over the past month, indicating an impending upward correction. Furthermore, Thursday's macroeconomic backdrop could be interpreted in different ways. The correlation between inflation and the European Central Bank's rates no longer exists, so a more significant slowdown in the EU Consumer Price Index did not trigger a decline in the euro, as it might have a few months ago. We can consider ECB President Christine Lagarde's speech as "moderately hawkish," and the minutes of the recent ECB meeting revealed that several members of the monetary committee supported a 0.5% rate hike in May. Thus, the euro had the right to grow.

There were an adequate number of trading signals, and since the movement was good and there was a trend-driven movement, it is not surprising for traders to gain profit. Initially, the pair bounced from the level of 1.0669 (a buy position should have been opened), then surpassed a critical line (supporting the trade), and finally reached the level of 1.0762 (where profit should have been taken). As a result, you could earn 85 pips. Such opportunities have been rare lately due to the lack of normal intraday trends.
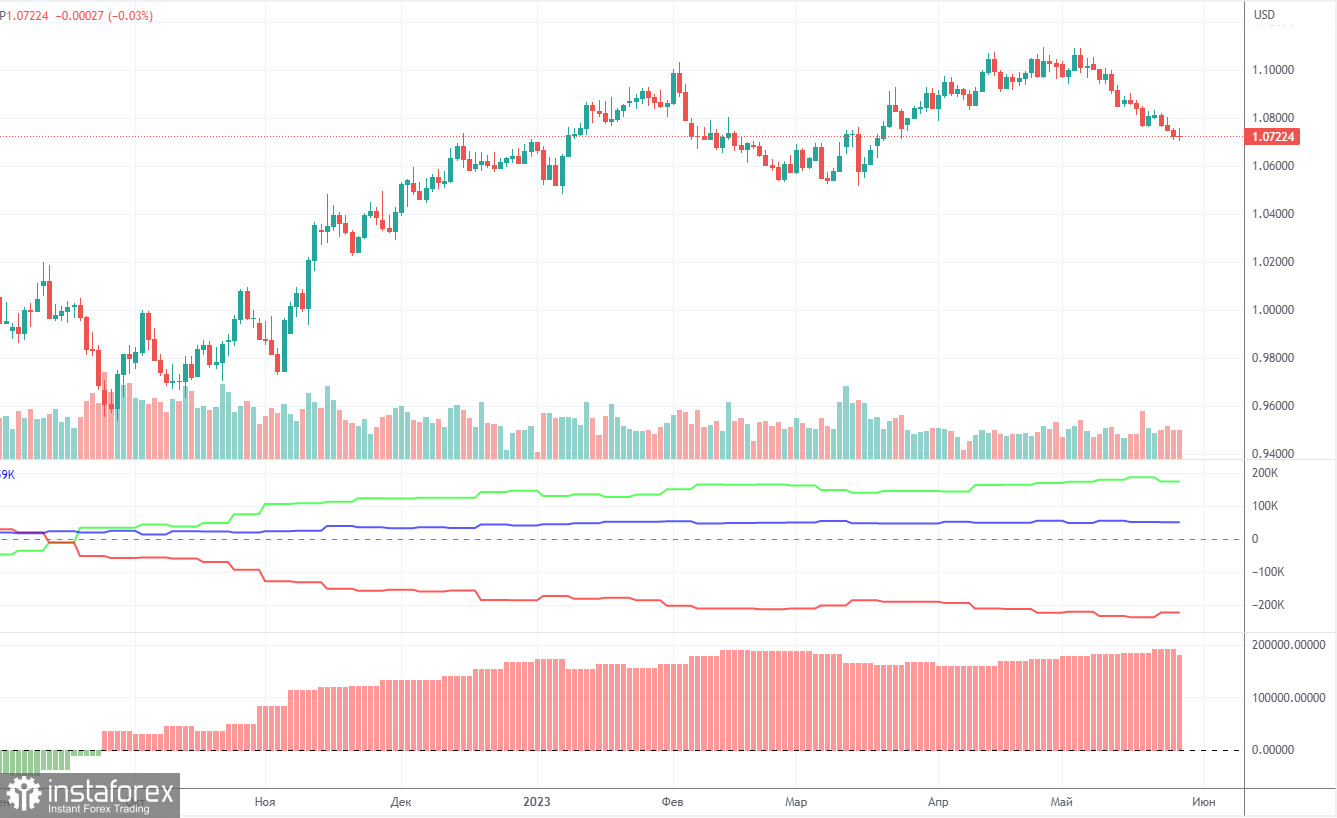
COT report:

This image is no longer relevant

The COT report for May 23 was delivered on Friday. Over the past nine months, COT data has been in line with developments in the market. The net position (second indicator on the chart) has been on the rise since September 2022. The euro started to show strength approximately at the same time. Currently, the net non-commercial position is bullish and keeps growing further. Likewise, the euro is bullish.

Notably, we may assume by the extremely bullish net position that the uptrend may soon stop. The first indicator shows that, and the red and green lines are far away from each other, which is usually a sign that the end of the trend might be nearing. The euro attempted to go down several months ago, but those were just minor pullbacks. In the reporting week, long positions of non-commercial traders decreased by 8,600 and short positions rose by 4,700. The net position dropped by 13,300. The number of long positions exceeds that of short ones by 174,000, a rather big gap. A correction or a new downtrend has started. So, it is clear that the pair will be bearish even without COT reports.
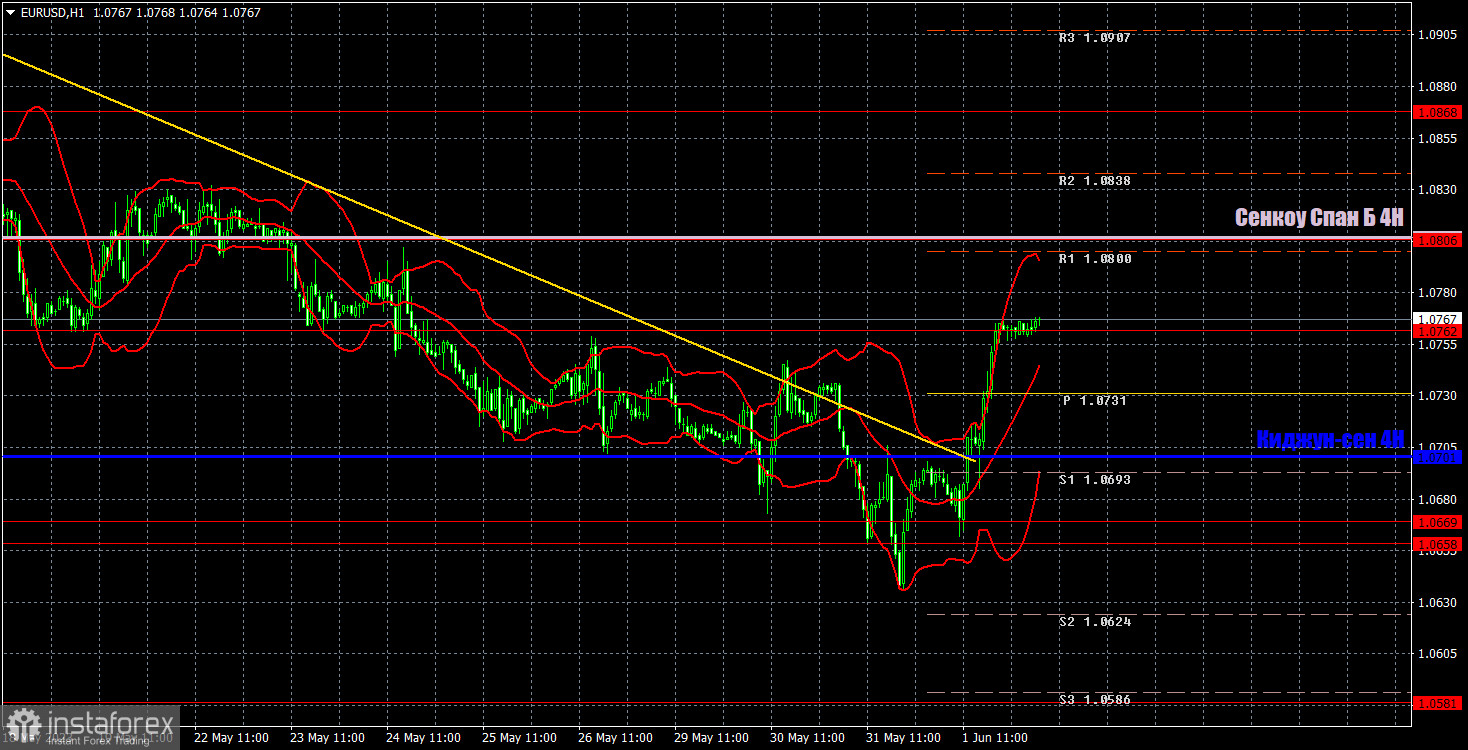
EUR/USD 1H

This image is no longer relevant

In the 1-hour time frame, the pair surpassed the descending trendline for the second time, clearly indicating its intention to form an uptrend. This should be a correction, and afterwards the downward movement should resume. However, for example, it seems like the pound intends to revive its medium-term uptrend, and the euro might do the same thing. Although, we firmly believe that there are currently no fundamental and macroeconomic reasons for such a move.

On June 2, trading levels are seen at 1.0537, 1.0581, 1.0658-1.0669, 1.0762, 1.0806, 1.0868, 1.0943, 1.1092, as well as the Senkou Span B (1.0807) and Kijun-sen (1.0701) lines. Ichimoku indicator lines can move intraday, which should be taken into account when determining trading signals. There are also support and resistance although no signals are made near these levels. Signals could be made when the price either breaks or bounces from these extreme levels. Do not forget to place Stop Loss at the breakeven point when the price goes by 15 pips in the right direction. In case of a false breakout, it could save you from possible losses.

Today, the event calendar is empty in the European Union. On the other hand, the United States will release its highly anticipated Nonfarm Payrolls and unemployment reports. The market's reaction will depend on the extent and direction of the deviation between the actual values and the forecasts. In any case, volatility could be relatively high today.

Indicators on charts:

Resistance/support - thick red lines, near which the trend may stop. They do not make trading signals.

Kijun-sen and Senkou Span B are the Ichimoku indicator lines moved to the hourly timeframe from the 4-hour timeframe. They are also strong lines.

Extreme levels are thin red lines, from which the price used to bounce earlier. They can produce trading signals.

Yellow lines are trend lines, trend channels, and other technical patterns.

Indicator 1 on the COT chart is the size of the net position of each trader category.

Indicator 2 on the COT chart is the size of the net position for the Non-commercial group of traders.

Paolo Greco,
Analytical expert of InstaForex
© 2007-2025
Select timeframe
5
min
15
min
30
min
1
hour
4
hours
1
day
1
week
Earn on cryptocurrency rate changes with InstaForex
Download MetaTrader 4 and open your first trade
  • Grand Choice
    Contest by
    InstaForex
    InstaForex always strives to help you
    fulfill your biggest dreams.
    JOIN CONTEST

Recommended Stories

How to Trade the GBP/USD Pair on May 16? Simple Tips and Trade Analysis for Beginners

Analysis of Thursday's Trades 1H Chart of GBP/USD On Thursday, the GBP/USD pair showed minimal upward movement; however, the 5-minute timeframe indicates this was largely a sideways move

Paolo Greco 06:17 2025-05-16 UTC+2

How to Trade the EUR/USD Pair on May 16? Simple Tips and Trade Analysis for Beginners

Analysis of Thursday's Trades 1H Chart of EUR/USD The EUR/USD currency pair traded in both directions throughout Thursday. The macroeconomic background was rich, but it had no decisive impact

Paolo Greco 06:17 2025-05-16 UTC+2

Trading Recommendations and Analysis for GBP/USD on May 16: The Pound Decided to Take a Break

On Thursday, the GBP/USD currency pair traded strictly sideways with low volatility. Despite a busy macroeconomic calendar, the market ignored most of the data, just as anticipated

Paolo Greco 03:54 2025-05-16 UTC+2

Trading Recommendations and Analysis for EUR/USD on May 16: The Market Has Once Again Confirmed the Obvious

On Thursday, the EUR/USD currency pair showed only one thing—a complete unwillingness to move. We observed sideways movement throughout the day despite a fairly packed macroeconomic calendar. However, as mentioned

Paolo Greco 03:54 2025-05-16 UTC+2

How to Trade the GBP/USD Pair on May 15? Simple Tips and Trade Analysis for Beginners

Analysis of Wednesday's Trades 1H Chart of GBP/USD The GBP/USD pair continued its upward movement throughout Wednesday, despite the absence of any specific fundamental reasons. The day before, a U.S

Paolo Greco 06:21 2025-05-15 UTC+2

How to Trade the EUR/USD Pair on May 15? Simple Tips and Trade Analysis for Beginners

Analysis of Wednesday's Trades 1H Chart of EUR/USD The EUR/USD currency pair experienced upward movement for approximately half of Wednesday. The latest "surge" in the euro was particularly "impressive," although

Paolo Greco 06:21 2025-05-15 UTC+2

Trading Recommendations and Analysis for GBP/USD on May 15: The Roller Coaster Begins

On Wednesday, the GBP/USD currency pair continued trading with an upward bias for some time, but it resumed its decline in the afternoon. From our perspective, the U.S. dollar

Paolo Greco 03:41 2025-05-15 UTC+2

Trading Recommendations and Analysis for EUR/USD on May 15: Heading Down Again or Waiting for Trump?

The EUR/USD currency pair continued upward movement on Wednesday, but only briefly. In the afternoon, the euro started to decline, despite the lack of macroeconomic factors supporting such moves. Donald

Paolo Greco 03:41 2025-05-15 UTC+2

How to Trade the GBP/USD Pair on May 14? Simple Tips and Trade Analysis for Beginners

Analysis of Tuesday's Trades 1H Chart of GBP/USD On Tuesday, the GBP/USD pair experienced significant growth, despite no clear catalyst behind it. On Monday, the dollar rose on specific grounds

Paolo Greco 06:11 2025-05-14 UTC+2

How to Trade the EUR/USD Pair on May 14? Simple Tips and Trade Analysis for Beginners

Analysis of Tuesday's Trades 1H Chart of EUR/USD On Tuesday, the EUR/USD currency pair nearly fully recovered from Monday's decline. As reality has shown, strong reasons are required

Paolo Greco 06:11 2025-05-14 UTC+2
Can't speak right now?
Ask your question in the chat.
Widget callback
 

Dear visitor,

Your IP address shows that you are currently located in the USA. If you are a resident of the United States, you are prohibited from using the services of InstaFintech Group including online trading, online transfers, deposit/withdrawal of funds, etc.

If you think you are seeing this message by mistake and your location is not the US, kindly proceed to the website. Otherwise, you must leave the website in order to comply with government restrictions.

Why does your IP address show your location as the USA?

  • - you are using a VPN provided by a hosting company based in the United States;
  • - your IP does not have proper WHOIS records;
  • - an error occurred in the WHOIS geolocation database.

Please confirm whether you are a US resident or not by clicking the relevant button below. If you choose the wrong option, being a US resident, you will not be able to open an account with InstaForex anyway.

We are sorry for any inconvenience caused by this message.