empty
02.10.2023 08:39 AM
EUR/USD: forecast and trading signals on October 2. EUR going through expected correction

Analysis of EUR/USD 5M

This image is no longer relevant

The EUR/USD pair continued its upward correction on Friday, which began a day earlier. We cannot day that the macroeconomic background on Friday either supported the European currency or worked against it. More likely, it didn't have much influence on market sentiment. Or it might have influenced it only as a trigger, while the market's direction was determined independently. Let's briefly review the key macroeconomic indicators. Unemployment and retail sales data in Germany turned out to be neutral and certainly didn't contribute to the euro's growth. Inflation in the European Union slowed down more than expected, but at the moment, it doesn't matter much as there's no longer a significant correlation between inflation and interest rates. In the United States, only a few reports of secondary importance were released, which didn't have any significant impact on the market.

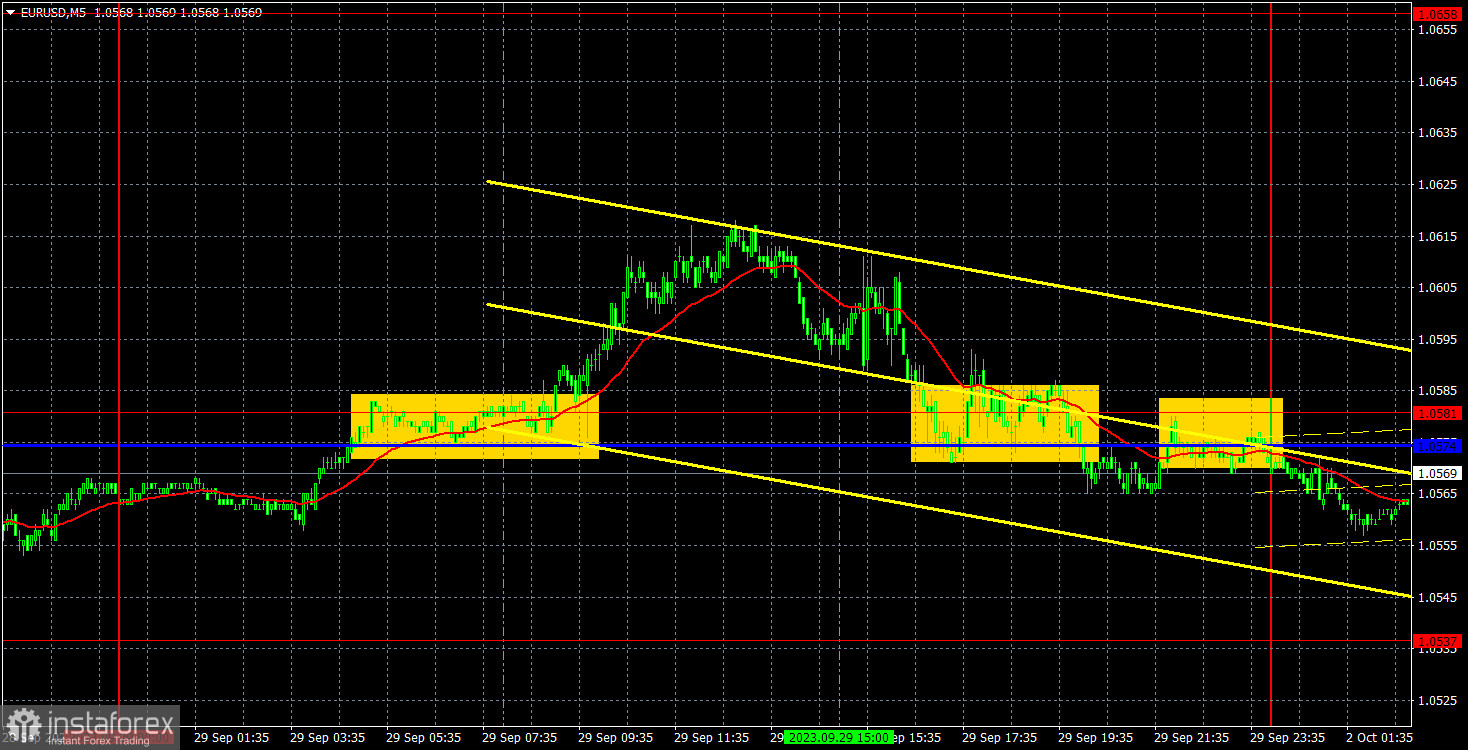
Several trading signals were generated throughout Friday. Initially, the price bounced off the 1.0574-1.0581 area and managed to move up about 30 pips. It's unlikely that traders were able to capture these pips, as the nearest target level was not reached. However, you could and should have set a break-even Stop Loss, which eventually closed the trade. Later on, the instrument returned to the 1.0574-1.0581 area and even settled below it, but this happened two hours before the market closed at the weekend. Clearly, opening a trade at that point was not advisable.

COT report

This image is no longer relevant

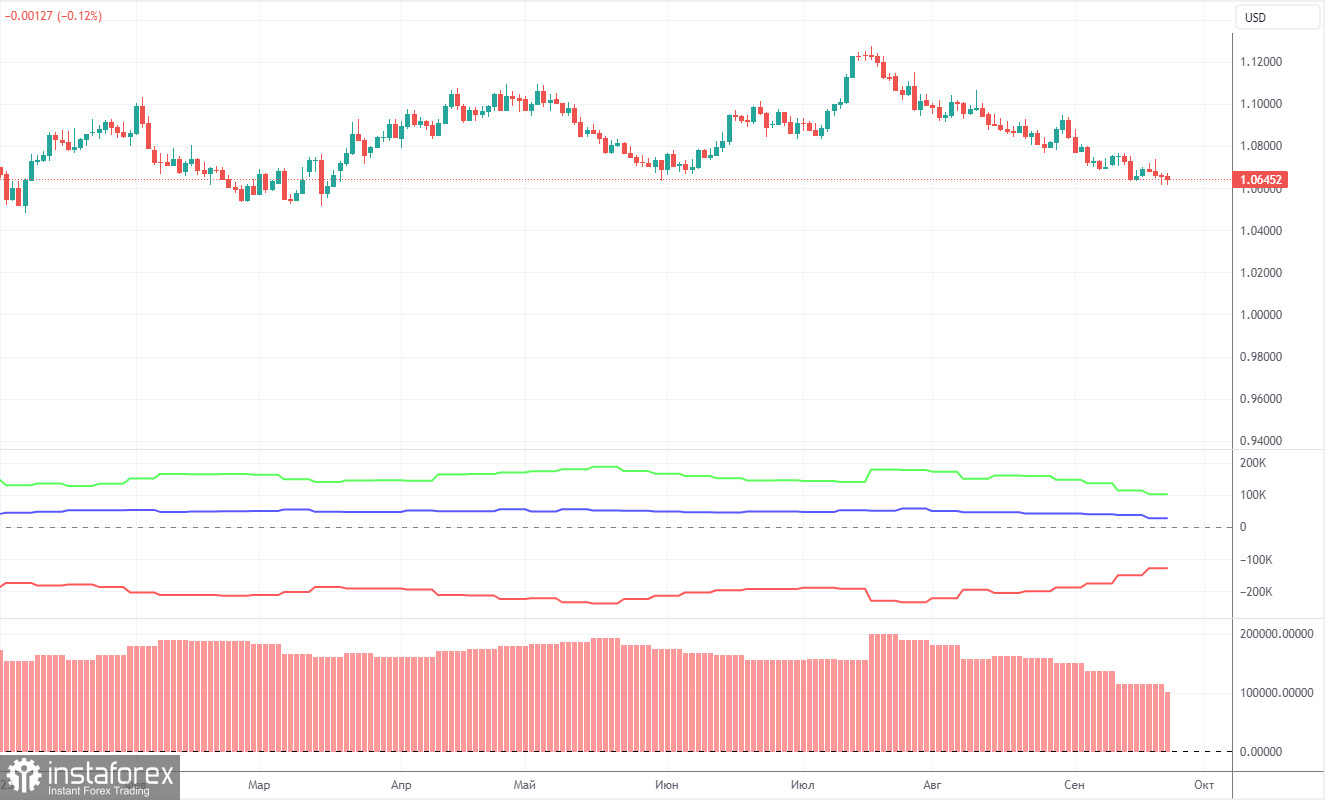
On Friday, a new COT report for September 26th was released. Over the past 12 months, the COT report data has been consistent with what's happening in the market. The net position of large traders (the second indicator) began to rise back in September 2022, roughly at the same time that the European currency started to rise. In the first half of 2023, the net position hardly increased, but the euro remained relatively high during this period. Only in the last two months, we have seen a decline in the euro and a drop in the net position, which we've been waiting for a long time. Currently, the net position of non-commercial traders is still bullish and this trend is likely to lose momentum soon.

Analysis of EUR/USD 1H

This image is no longer relevant

We have previously noted that the red and green lines have moved significantly apart from each other, which often precedes the end of a trend. This configuration persisted for over half a year, but eventually, the situation began to change. Therefore, we still stick to the scenario that the upward trend is over. During the last reporting week, the number of long positions for the "Non-commercial" group increased by 4,000, while the number of short positions increased by 7,600. Consequently, the net position decreased by 3,600 contracts. The number of BUY contracts is higher than the number of SELL contracts among non-commercial traders by 99,000, but the gap is narrowing, which is a positive sign. In principle, it is now evident even without COT reports that the European currency is set to extend its weakness. Now the COT reports support this scenario.

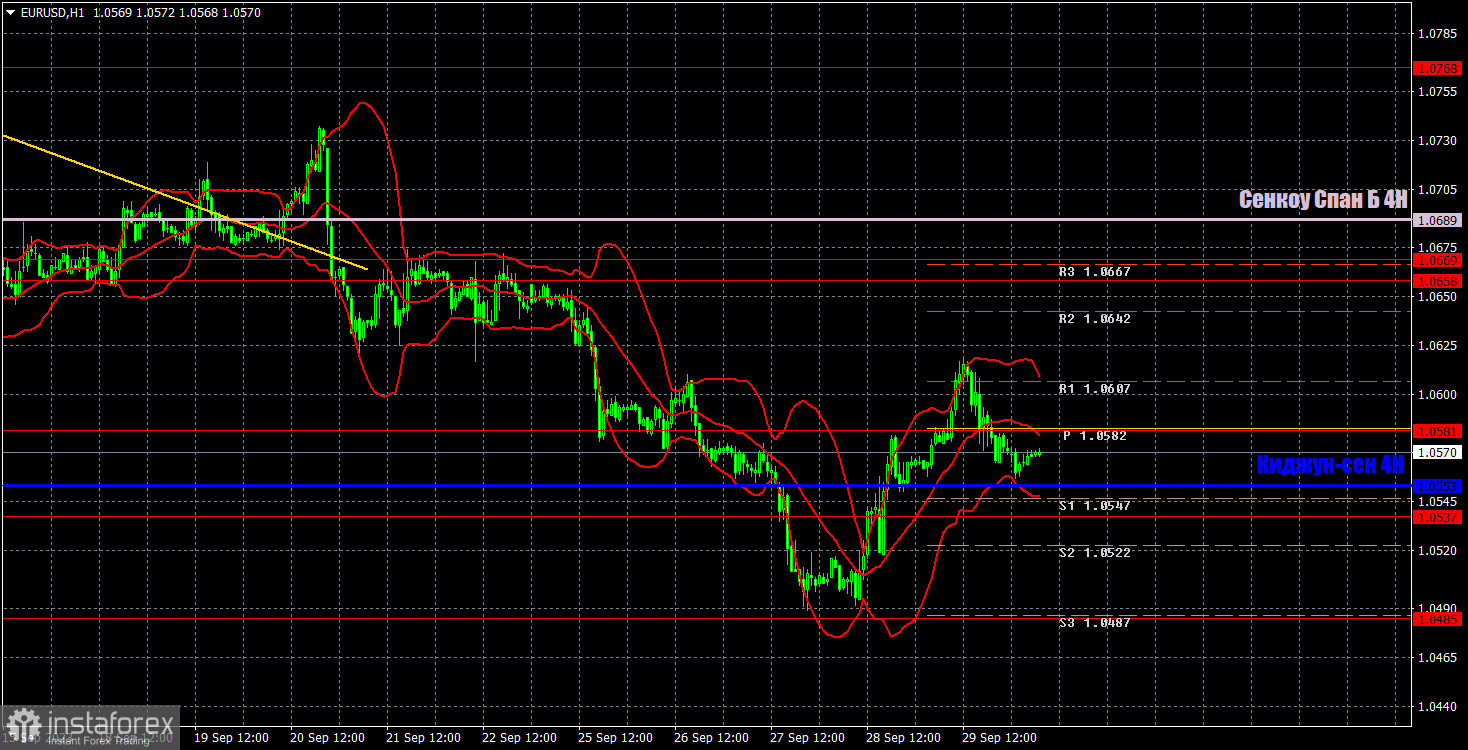
On the 1-hour timeframe, the pair maintains a downward trend but has begun to correct. We believe that the dollar will continue to advance in the medium term, but in the next few days or even weeks, technical euro's growth is possible. Overcoming the Kijun-sen line confirms the market's intention to make a slight correction. The nearest target is the Senkou Span B line.

On October 2nd, we highlight the following levels for trading: 1.0366, 1.0485, 1.0537, 1.0581, 1.0658-1.0669, 1.0768, 1.0806, 1.0868, 1.0935, 1.1043, as well as the Senkou Span B (1.0689) and Kijun-sen (1.0553) lines. The Ichimoku indicator lines can shift during the day, so this should be taken into account when identifying trading signals. There are also auxiliary support and resistance levels, but signals are not formed near them. Signals can be "bounces" and "breakouts" of extreme levels and lines. Don't forget to set a breakeven Stop Loss if the price has moved in the right direction by 15 pips. This will protect against potential losses if the signal turns out to be false.

On Monday, business activity indices in the manufacturing sectors for September will be published in the United States, the European Union, in particular, Germany. These are not the most important data because the PMIs will be in the second estimate. However, among them, there will be the ISM index in the United States, which is much more important than its counterparts. Also, today, Jerome Powell will deliver a speech in the second half of the day.

What's on charts

Price levels of support and resistance (resistance / support) are plotted by thick red lines, near which the movement may end. They are not sources of trading signals.

The Kijun-sen and Senkou Span B lines are the Ichimoku indicator lines transferred to the 1-hour timeframe from the 4-hour timeframe. They are strong lines.

Extreme levels are thin red lines, from which the price bounced or dipped earlier. They are sources of trading signals.

Yellow lines are trend lines, trend channels and any other technical patterns.

Indicator 1 on the COT charts means the size of the net position of each category of traders.

Indicator 2 on the COT charts means the size of the net position for the Non-commercial group.

Paolo Greco,
ผู้เชี่ยวชาญด้านการวิเคราะห์ของ InstaForex
© 2007-2025
เลือกช่วงเวลา
5
นาที
15
นาที
30
นาที
1
ชั่วโมง
4
ชั่วโมง
1
วัน
1
สัปดาห์
รับผลกำไรจากการเปลี่ยนแปลงอัตราสกุลเงินดิจิทัลกับ InstaForex.
ดาวน์โหลด MetaTrader 4 และเปิดการซื้อขายครั้งแรกของคุณ.
  • Grand Choice
    Contest by
    InstaForex
    InstaForex always strives to help you
    fulfill your biggest dreams.
    เข้าร่วมการแข่งขัน


บทความแนะนำ

GBP/USD: แผนการซื้อขายสำหรับช่วงการเงินสหรัฐฯ ในวันที่ 11 มิถุนายน (รีวิวการซื้อขายช่วงเช้า)

ในรายงานพยากรณ์ตอนเช้าของฉัน ฉันได้เน้นไปที่ระดับ 1.3483 และวางแผนที่จะตัดสินใจในการเทรดตามนั้น มาดูกราฟ 5 นาทีและวิเคราะห์เหตุการณ์ที่เกิดขึ้น การปรับตัวขึ้นและการเกิดจุดผิดพลาดหลอกในระดับนั้นนำไปสู่การเข้าเทรดขาลง ส่งผลให้ราคาลดลง 20 จุด ภาพเทคนิคถูกปรับปรุงใหม่สำหรับช่วงครึ่งหลังของวัน เปิดตำแหน่งซื้อใน GBP/USD: ข้อมูล

Miroslaw Bawulski 18:41 2025-06-11 UTC+2

EUR/USD: แผนการซื้อขายสำหรับเซสชั่นในสหรัฐอเมริกาวันที่ 11 มิถุนายน (การทบทวนการซื้อขายช่วงเช้า)

ในคำพยากรณ์ช่วงเช้าของฉัน ฉันได้เน้นถึงระดับ 1.1425 และวางแผนที่จะตัดสินใจเข้าซื้อขายตามระดับนี้ มาดูกราฟ 5 นาทีและตรวจสอบว่าเกิดอะไรขึ้นบ้าง ราคาปรับตัวขึ้นเหนือ 1.1425 แต่ไม่มีการกลับตัวเพื่อลองทดสอบใหม่ ดังนั้นฉันจึงไม่ได้เปิดการซื้อขายใด ๆ ในช่วงครึ่งแรกของวัน มุมมองทางเทคนิคถูกปรับใหม่สำหรับช่วงครึ่งหลังของวัน การแข็งค่าขึ้นของยูโรจะขึ้นอยู่กับข้อมูลเงินเฟ้อของสหรัฐฯ

Miroslaw Bawulski 18:38 2025-06-11 UTC+2

วิธีการซื้อขายคู่เงิน GBP/USD ในวันที่ 11 มิถุนายน? เคล็ดลับง่าย ๆ และการวิเคราะห์การซื้อขายสำหรับมือใหม่

ในวันอังคาร คู่เงิน GBP/USD มีแนวโน้มลดลง ซึ่งเกิดจากหลายปัจจัย อย่างแรกคู่เงินได้ย่อต่ำกว่าระดับแนวโน้มขาขึ้น เราไม่เชื่อว่าแนวโน้มการลดลงใหม่ของเงินปอนด์อังกฤษจะเริ่มต้น เนื่องจาก Donald Trump อาจกระตุ้นให้เกิดการขายเงินดอลลาร์และในขณะนี้ยังไม่มีข่าวบวกเกี่ยวกับหัวข้อสำคัญต่างๆ อย่างไรก็ตามเป็นครั้งคราวคู่เงินก็จำเป็นต้องมีการปรับตัวลงบ้าง สอง ตัวเลขสถิติทางเศรษฐกิจของสหราชอาณาจักรออกมาอ่อนแอมาก อัตราการว่างงานเพิ่มขึ้นและจำนวนคนยื่นขอรับสวัสดิการคนว่างงานสูงกว่าการคาดการณ์ถึงสามเท่า

Paolo Greco 06:10 2025-06-11 UTC+2

วิธีการเทรดคู่สกุลเงิน EUR/USD ในวันที่ 11 มิถุนายน? เคล็ดลับง่าย ๆ และการวิเคราะห์การเทรดสำหรับผู้เริ่มต้น

เมื่อวันอังคาร คู่สกุลเงิน EUR/USD แสดงให้เห็นว่าไม่มีความตั้งใจที่จะทำการค้าอย่างจริงจังอีกครั้ง ในช่วงสามวันที่ผ่านมามีช่องทางเคลื่อนไหวข้างที่เกิดขึ้นในกรอบเวลาแบบรายชั่วโมง และความผันผวนของคู่สกุลเงินนี้ยังคงอยู่ในระดับต่ำมาก ในแง่หนึ่งนี่ถือว่าเข้าใจได้ — ไม่มีพื้นฐานทางเศรษฐกิจมหภาคในช่วงนี้ และตลาดไม่ได้ตอบสนองต่อข่าวเกี่ยวกับการประท้วงในสหรัฐฯ การปราบปราม หรือการเจรจาการค้าระหว่างสหรัฐฯ กับจีน อย่างไรก็ตาม การประท้วงในสหรัฐฯ

Paolo Greco 06:10 2025-06-11 UTC+2

คำแนะนำและการวิเคราะห์การเทรด GBP/USD ประจำวันที่ 11 มิถุนายน: เงินปอนด์หยุดพักก่อนที่จะทะยานขึ้นครั้งใหม่

คู่สกุลเงิน GBP/USD ยังคงซื้อขายค่อนข้างยุ่งเหยิงในวันอังคารแต่มีแนวโน้มขาลง ค่าเงินปอนด์ของอังกฤษลดลงเล็กน้อยหลังจากแนวโน้มเปลี่ยนไปในทิศทางขาลง จำได้ว่าเมื่อไม่กี่วันก่อน ราคาทะลุผ่านแนวโน้มอีกเส้นหนึ่ง (หรือช่องราคา) ซึ่งบ่งชี้ถึงการก่อตัวของแนวโน้มขาลงใหม่ อย่างไรก็ตาม, ในกรณีก่อนหน้านี้ เราไม่เห็นการลดลงที่ชัดเจนใด ๆ และแม้ว่าจะมีก็จบลงอย่างรวดเร็ว ในหลักการ เราได้พูดสิ่งเดิมๆ

Paolo Greco 03:31 2025-06-11 UTC+2

คำแนะนำและการวิเคราะห์การซื้อขายสำหรับ EUR/USD ในวันที่ 11 มิถุนายน: การเคลื่อนไหวแบบคงที่ในระดับสูง

คู่สกุลเงิน EUR/USD ยังคงเคลื่อนไหวในทั้งสองทิศทางตลอดวันอังคาร การเคลื่อนไหวเหล่านี้บ่งบอกถึงตลาดที่ค่อนข้างนิ่งมาก่อนหน้านี้ โดยคู่สกุลเงินได้ทำการแตกผ่านเส้นแนวโน้มขาขึ้นเป็นครั้งที่สอง ซึ่งไม่ก่อให้เกิดการลดลงอย่างชัดเจน ดังนั้นอีกครั้งที่ดอลลาร์สหรัฐไม่สามารถเสริมความแข็งแกร่งให้กับตัวมันเองได้ แม้ว่าจะมีเหตุผลที่สมควรพอในการทำเช่นนั้นก็ตาม ก่อนหน้านี้ เราเจอสถานการณ์หลายครั้งที่ข้อมูลเศรษฐกิจมหภาคที่ดีหรือสภาพพื้นฐานทางการเงินที่แข็งแกร่งไม่ได้นำไปสู่การแข็งค่าของดอลลาร์สหรัฐ ตลาดมักจะมองข้ามสิ่งเหล่านี้แล้วไปสนใจในเหตุการณ์ที่ใหญ่กว่าและสำคัญกว่า ซึ่งแน่นอนว่าเกี่ยวพันกับ Donald Trump ดังนั้นมันจึงเกิดขึ้นบ่อยครั้งที่ดอลลาร์ปฏิเสธที่จะขึ้นราคา

Paolo Greco 03:31 2025-06-11 UTC+2

GBP/USD: แผนการซื้อขายสำหรับช่วงสหรัฐอเมริกาในวันที่ 10 มิถุนายน (ทบทวนการซื้อขายช่วงเช้า)

ในคำพยากรณ์ช่วงเช้าของฉัน ฉันได้กล่าวถึงระดับ 1.3545 และวางแผนที่จะใช้ระดับนี้ในการตัดสินใจเข้าตลาด ลองมาดูกราฟ 5 นาทีเพื่อดูว่าเกิดอะไรขึ้น การเพิ่มขึ้นตามด้วยการทะลุหลอกที่ระดับนั้นนำไปสู่สัญญาณการขายสำหรับปอนด์ ส่งผลให้คู่สกุลเงินมีการปรับตัวลดลงอย่างมาก ภาพทางเทคนิคถูกปรับใหม่สำหรับครึ่งหลังของวัน การเปิดสถานะ Long บน GBP/USD: ข้อมูลตลาดแรงงานที่อ่อนจากสหราชอาณาจักรทำให้แรงกดดันต่อปอนด์ในช่วงครึ่งแรกของวัน

Miroslaw Bawulski 18:26 2025-06-10 UTC+2

EUR/USD: แผนการเทรดสำหรับเซสชั่นสหรัฐในวันที่ 10 มิถุนายน (การทบทวนการซื้อขายช่วงเช้า)

ในคำพยากรณ์ช่วงเช้าของฉัน ฉันได้เน้นถึงระดับ 1.1388 และวางแผนที่จะทำการตัดสินใจเข้าสู่ตลาดโดยอิงจากระดับนี้ มาดูกราฟ 5 นาทีเพื่อดูว่าเกิดอะไรขึ้น การลดลงและการก่อตัวที่ผิดพลาดรอบ 1.1388 นำไปสู่สัญญาณซื้อสำหรับยูโร ส่งผลให้ราคาขึ้นมากกว่า 40 จุด ภาพทางเทคนิคไม่ได้มีการปรับแก้ใหม่สำหรับช่วงครึ่งหลังของวัน การเปิดสถานะ

Miroslaw Bawulski 18:22 2025-06-10 UTC+2

วิธีการเทรดคู่สกุลเงิน GBP/USD ในวันที่ 10 มิถุนายน? เคล็ดลับง่ายๆ และการวิเคราะห์การเทรดสำหรับมือใหม่

คู่สกุลเงิน GBP/USD ก็มีการซื้อขายในทั้งสองทิศทางเมื่อวันจันทร์ ที่วันศุกร์ ราคามีการเคลื่อนไหวต่ำกว่าเส้นแนวโน้มขาขึ้น โดยเปลี่ยนแนวโน้มเป็นขาลงในทางทฤษฎี เป็นเพราะว่าเรามีสิ่งที่คล้ายกันเกิดขึ้นเมื่อสัปดาห์ที่แล้วเมื่อเงินปอนด์สเตอร์ลิงเคลื่อนไหวต่ำกว่าเส้นแนวโน้มขาขึ้นก่อนหน้าในทำนองเดียวกัน แต่ในขณะนั้น เราไม่ได้เห็นการลดลงที่สำคัญในคู่เงินนี้ ดังนั้นพื้นฐานของตลาดในปัจจุบันบ่งบอกว่าอาจมีการลดลงของดอลลาร์ในการซื้อขายใหม่ได้ตลอดเวลา แม้ว่ามีการสร้างสัญญาณซื้อหรือตลาดจะเปลี่ยนเป็นขาลงก็ตาม ตลาดไม่ต้องการเกี่ยวข้องกับสกุลเงินที่ประเทศของประธานาธิบดีมักปรากฏในศาล ดำเนินการที่แปลกและขัดต่อรัฐธรรมนูญ จูงใจให้เกิดความขัดแย้งทางการค้า และล้มเหลวในการปฏิบัติตามสัญญาช่วงการเลือกตั้ง

Paolo Greco 06:40 2025-06-10 UTC+2

วิธีการเทรดคู่สกุลเงิน EUR/USD ในวันที่ 10 มิถุนายน? เคล็ดลับง่ายๆ และการวิเคราะห์การเทรดสำหรับผู้เริ่มต้น

คู่สกุลเงิน EUR/USD ซื้อขายด้วยความผันผวนต่ำและในทั้งสองทิศทางในวันจันทร์ วันนี้มีปัจจัยทางเศรษฐกิจมหภาคที่แทบไม่มีอยู่เลย ทำให้เทรดเดอร์มีสิ่งที่ต้องตอบสนองน้อยมาก แน่นอนว่าข่าวยังคงเกิดขึ้นจากสหรัฐอเมริกาอย่างต่อเนื่อง เนื่องจากโดนัลด์ ทรัมป์ยังคงตัดสินใจและแถลงการณ์หลายอย่างที่ตอนนี้ไม่เพียงแต่ทำให้นักเศรษฐศาสตร์เท่านั้นที่ตกตะลึง สำหรับการสร้างความทรงจำ เมื่อวันที่ 6 มิถุนายน มีการประท้วงและการจลาจลที่ปะทุขึ้นในหลายเมืองของอเมริกาเพื่อต่อต้านนโยบายการเข้าเมืองใหม่ของทรัมป์ เพื่อตอบสนองต่อเหตุการณ์นี้ ทรัมป์ได้สั่งการให้ใช้กองกำลังป้องกันชาติเพื่อปราบปรามการประท้วง

Paolo Greco 06:40 2025-06-10 UTC+2
หากไม่สะดวกคุยในตอนนี้
ระบุคำถามไว้ได้ใน แชท.
Widget callback
 

Dear visitor,

Your IP address shows that you are currently located in the USA. If you are a resident of the United States, you are prohibited from using the services of InstaFintech Group including online trading, online transfers, deposit/withdrawal of funds, etc.

If you think you are seeing this message by mistake and your location is not the US, kindly proceed to the website. Otherwise, you must leave the website in order to comply with government restrictions.

Why does your IP address show your location as the USA?

  • - you are using a VPN provided by a hosting company based in the United States;
  • - your IP does not have proper WHOIS records;
  • - an error occurred in the WHOIS geolocation database.

Please confirm whether you are a US resident or not by clicking the relevant button below. If you choose the wrong option, being a US resident, you will not be able to open an account with InstaForex anyway.

We are sorry for any inconvenience caused by this message.